Kipling catalogue
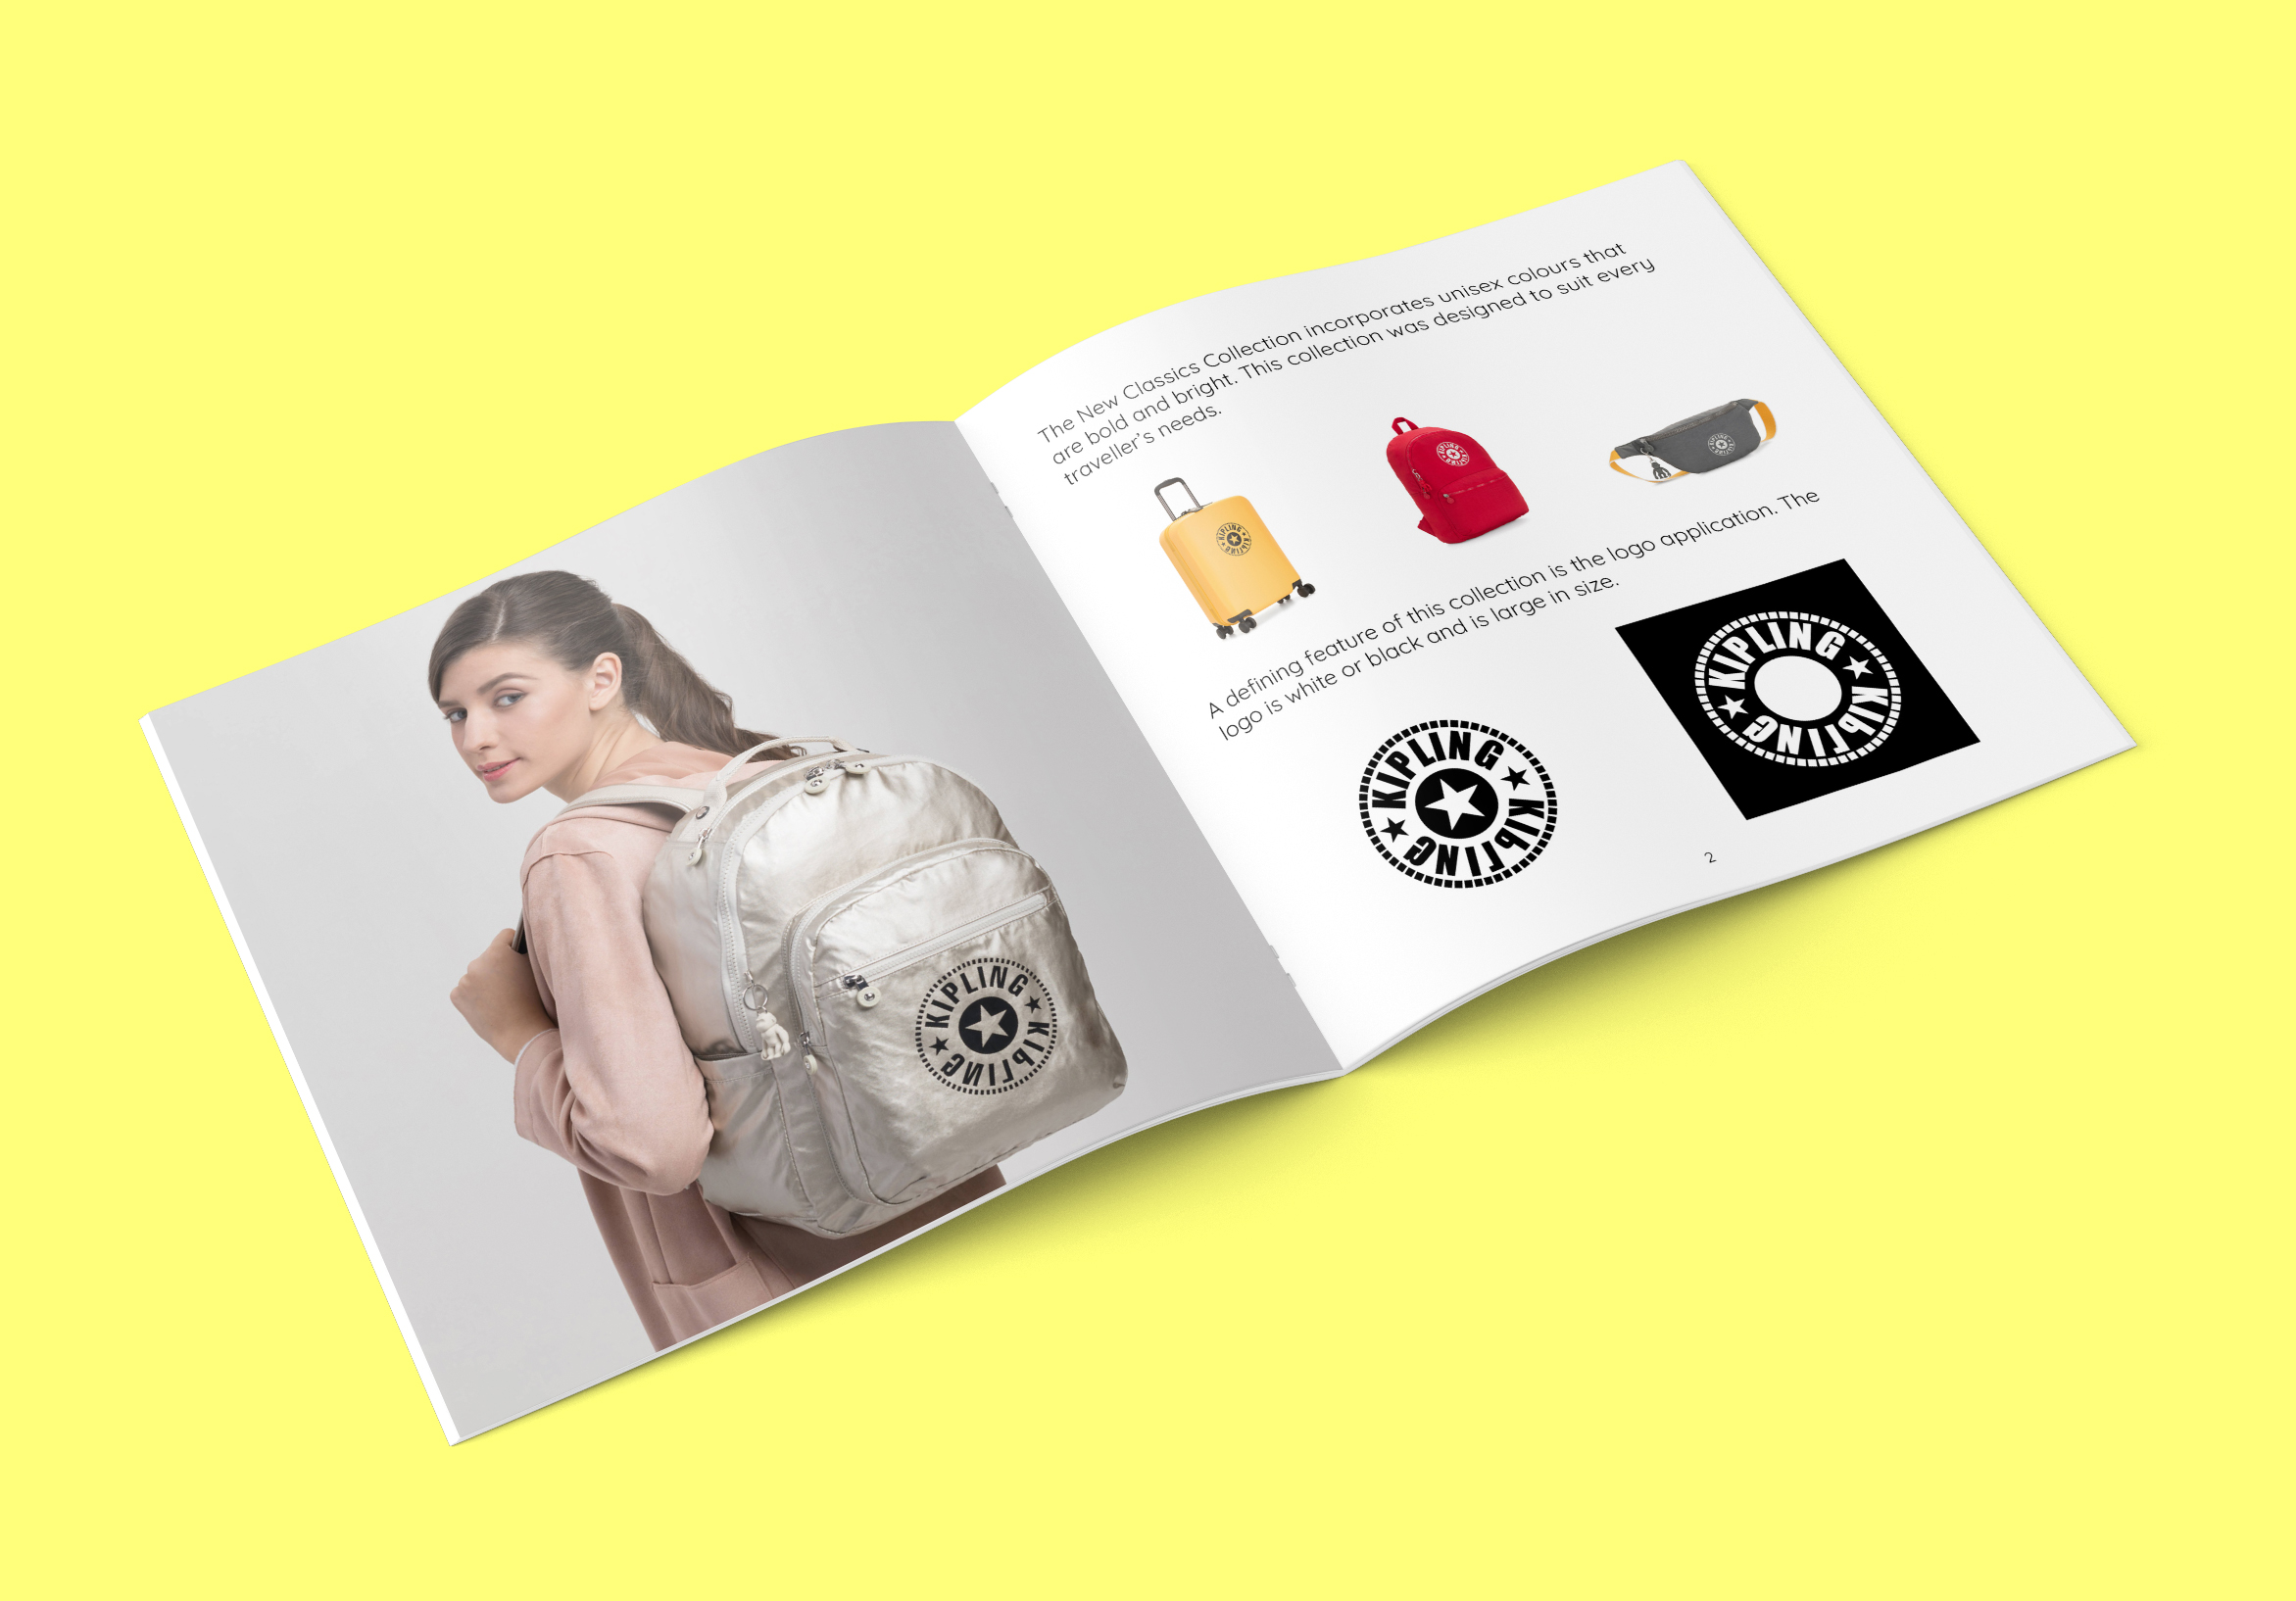
Kipling released their new line NEW CLASSICS in 2018. This line has bold and bright colours suited for the needs of every traveler. I created a product catalogue that incorporates data visualization to compare all the bags in the NEW CLASSICS collection.
Brief
Problem being solved: The Kipling website displays all the products in the NEW CLASSICS line but provides little organization to help the customer understand unique differences between products. Customers need a quick way to determine a purchase that is right for them.
Target audience: 20 to 30 year-olds who needs a quick way to decide the right product for them based on appearance and function.
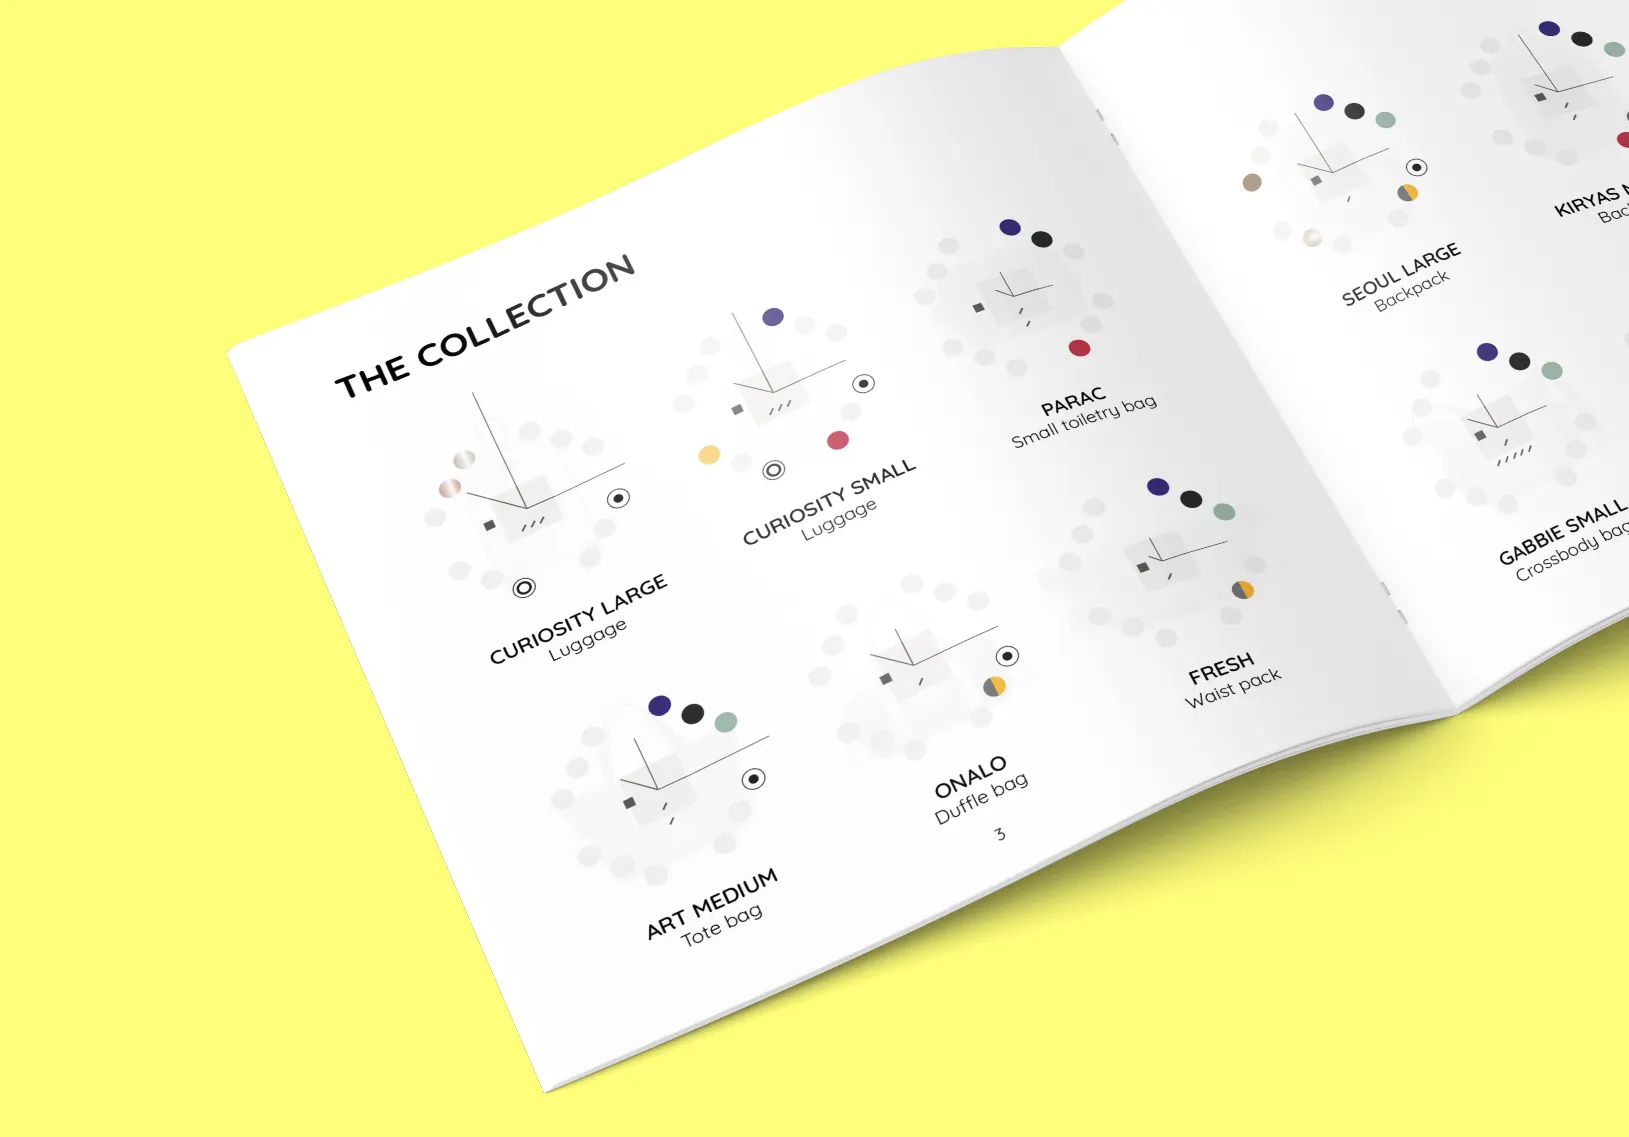
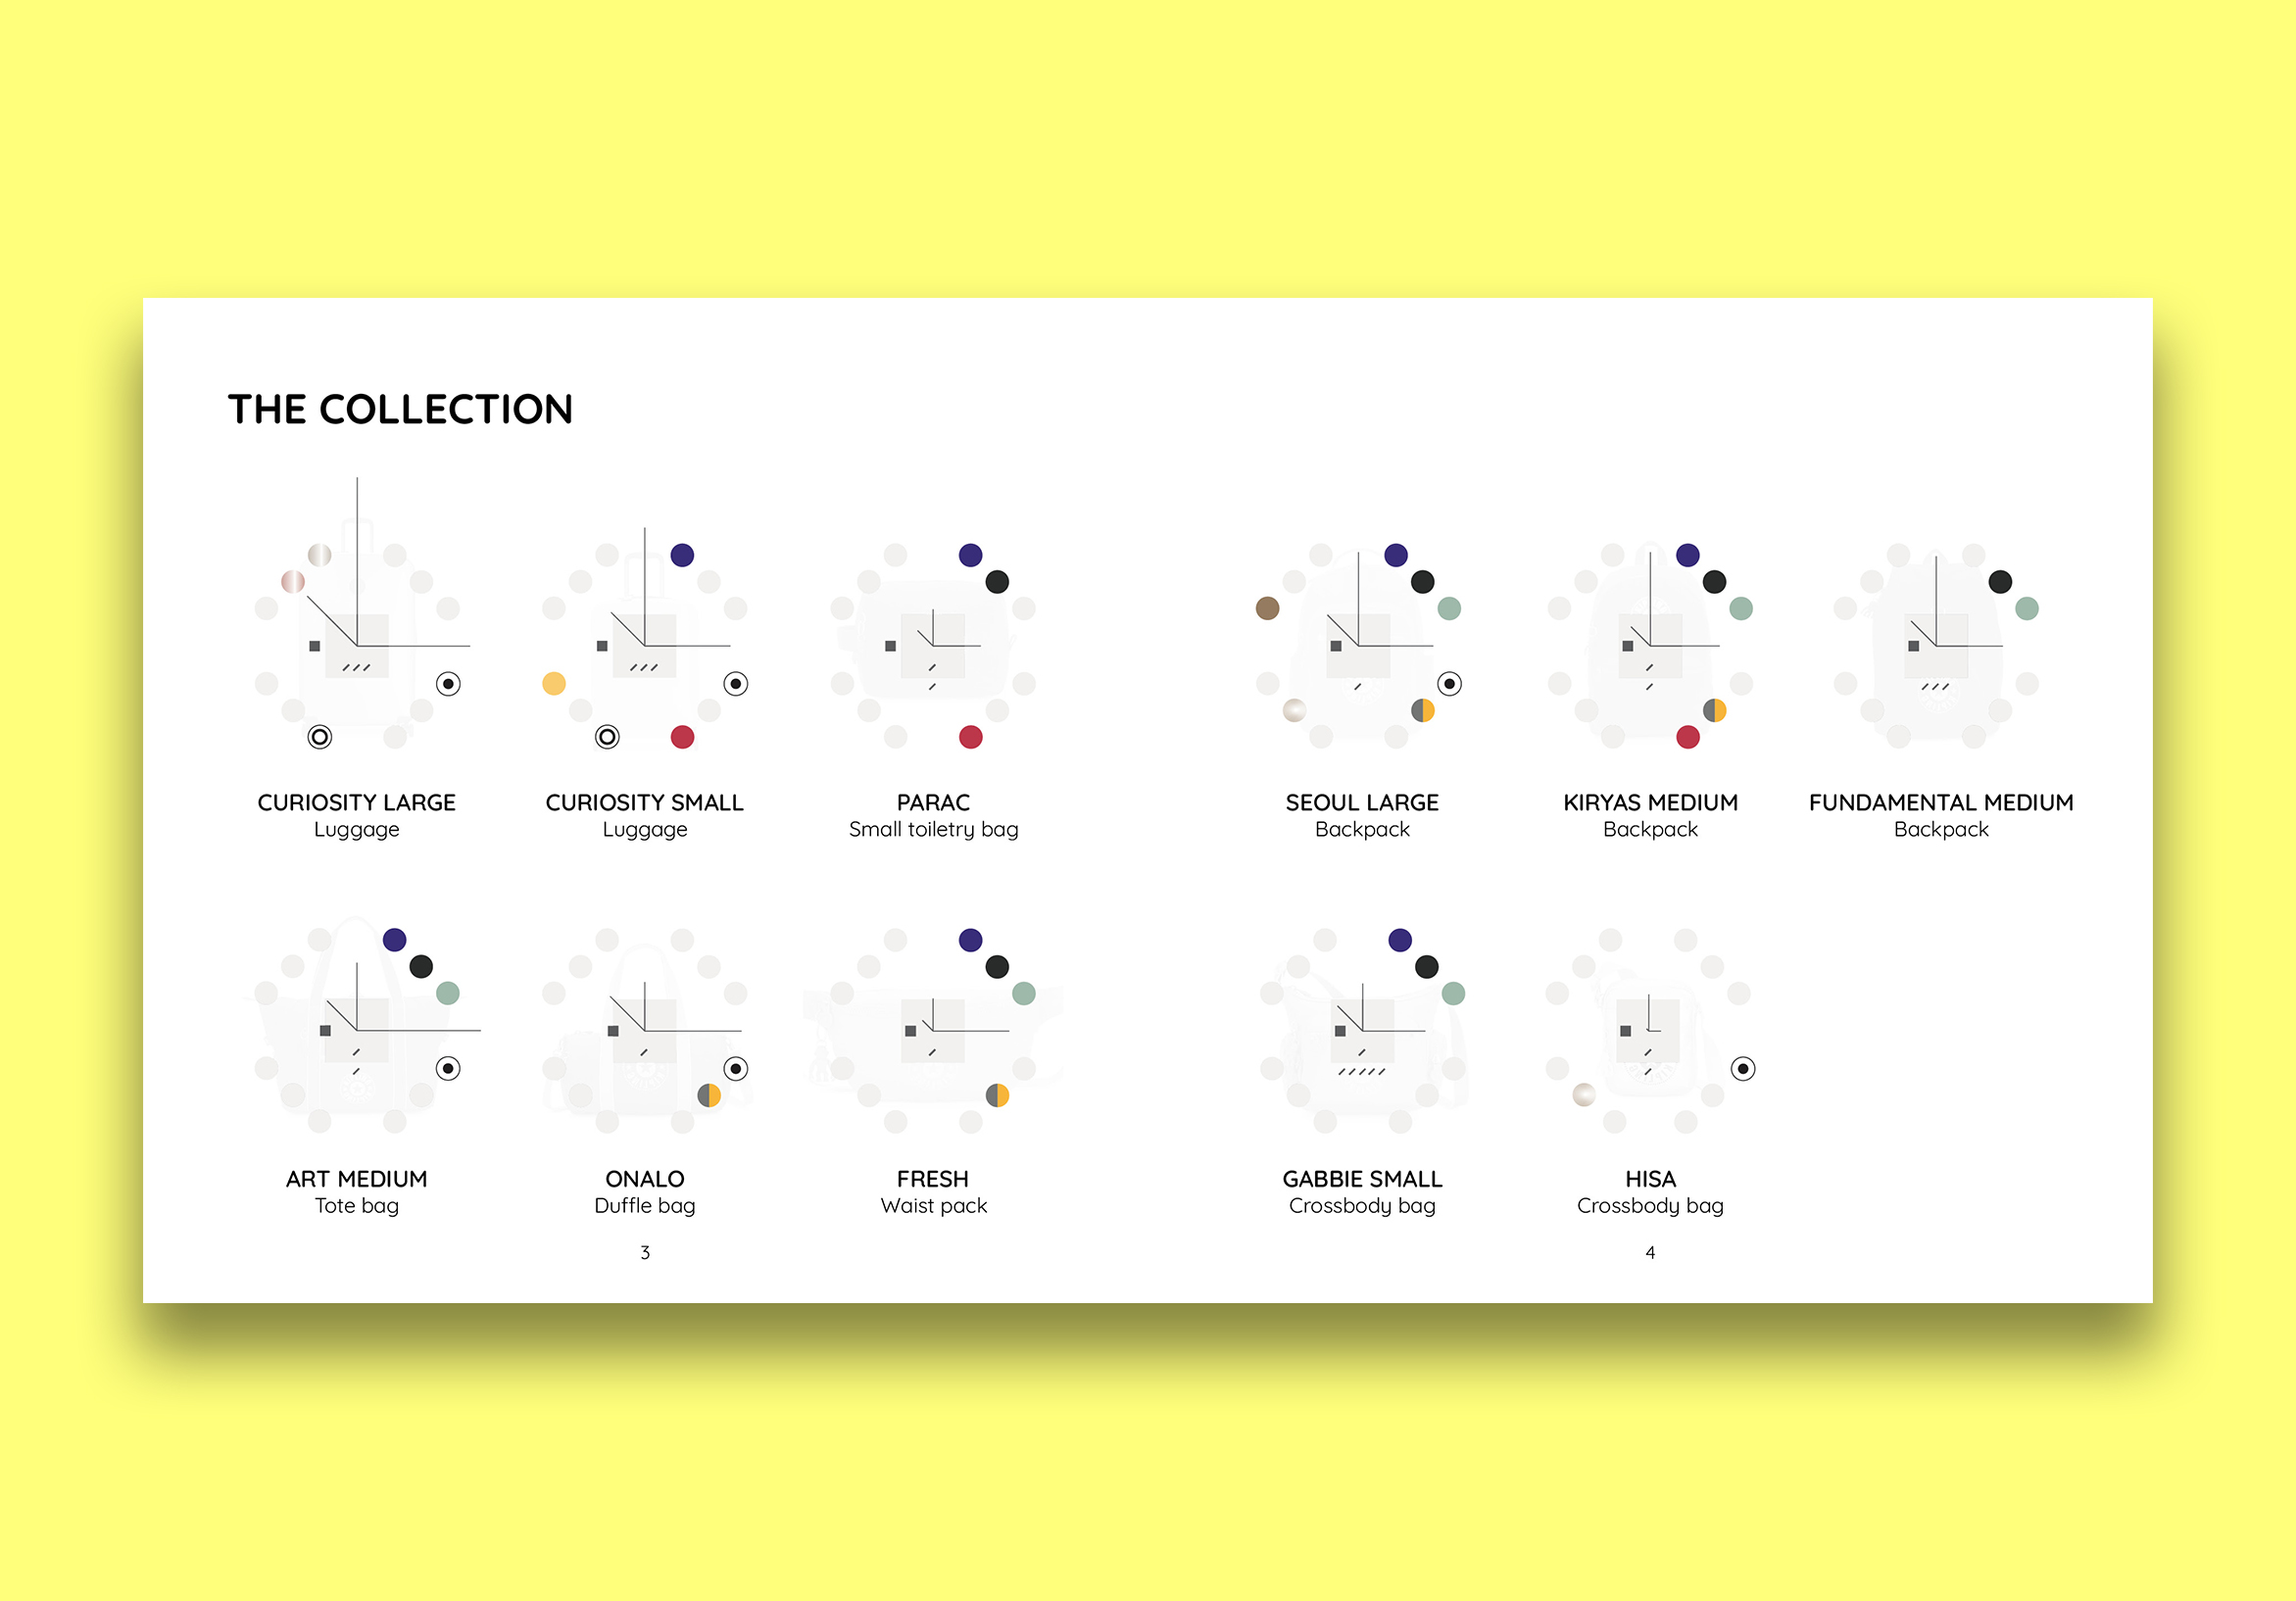
Key objective: Create a print catalogue that summarizes all the types of products in the NEW CLASSICS line. Key attributes need to show primary factors that determine a purchase being made.
Process
Over 30 products are displayed on the Kipling USA website and show the colour variations as separate product images. The website is cluttered and it is very difficult to quickly grasp what the NEW CLASSICS line offers.
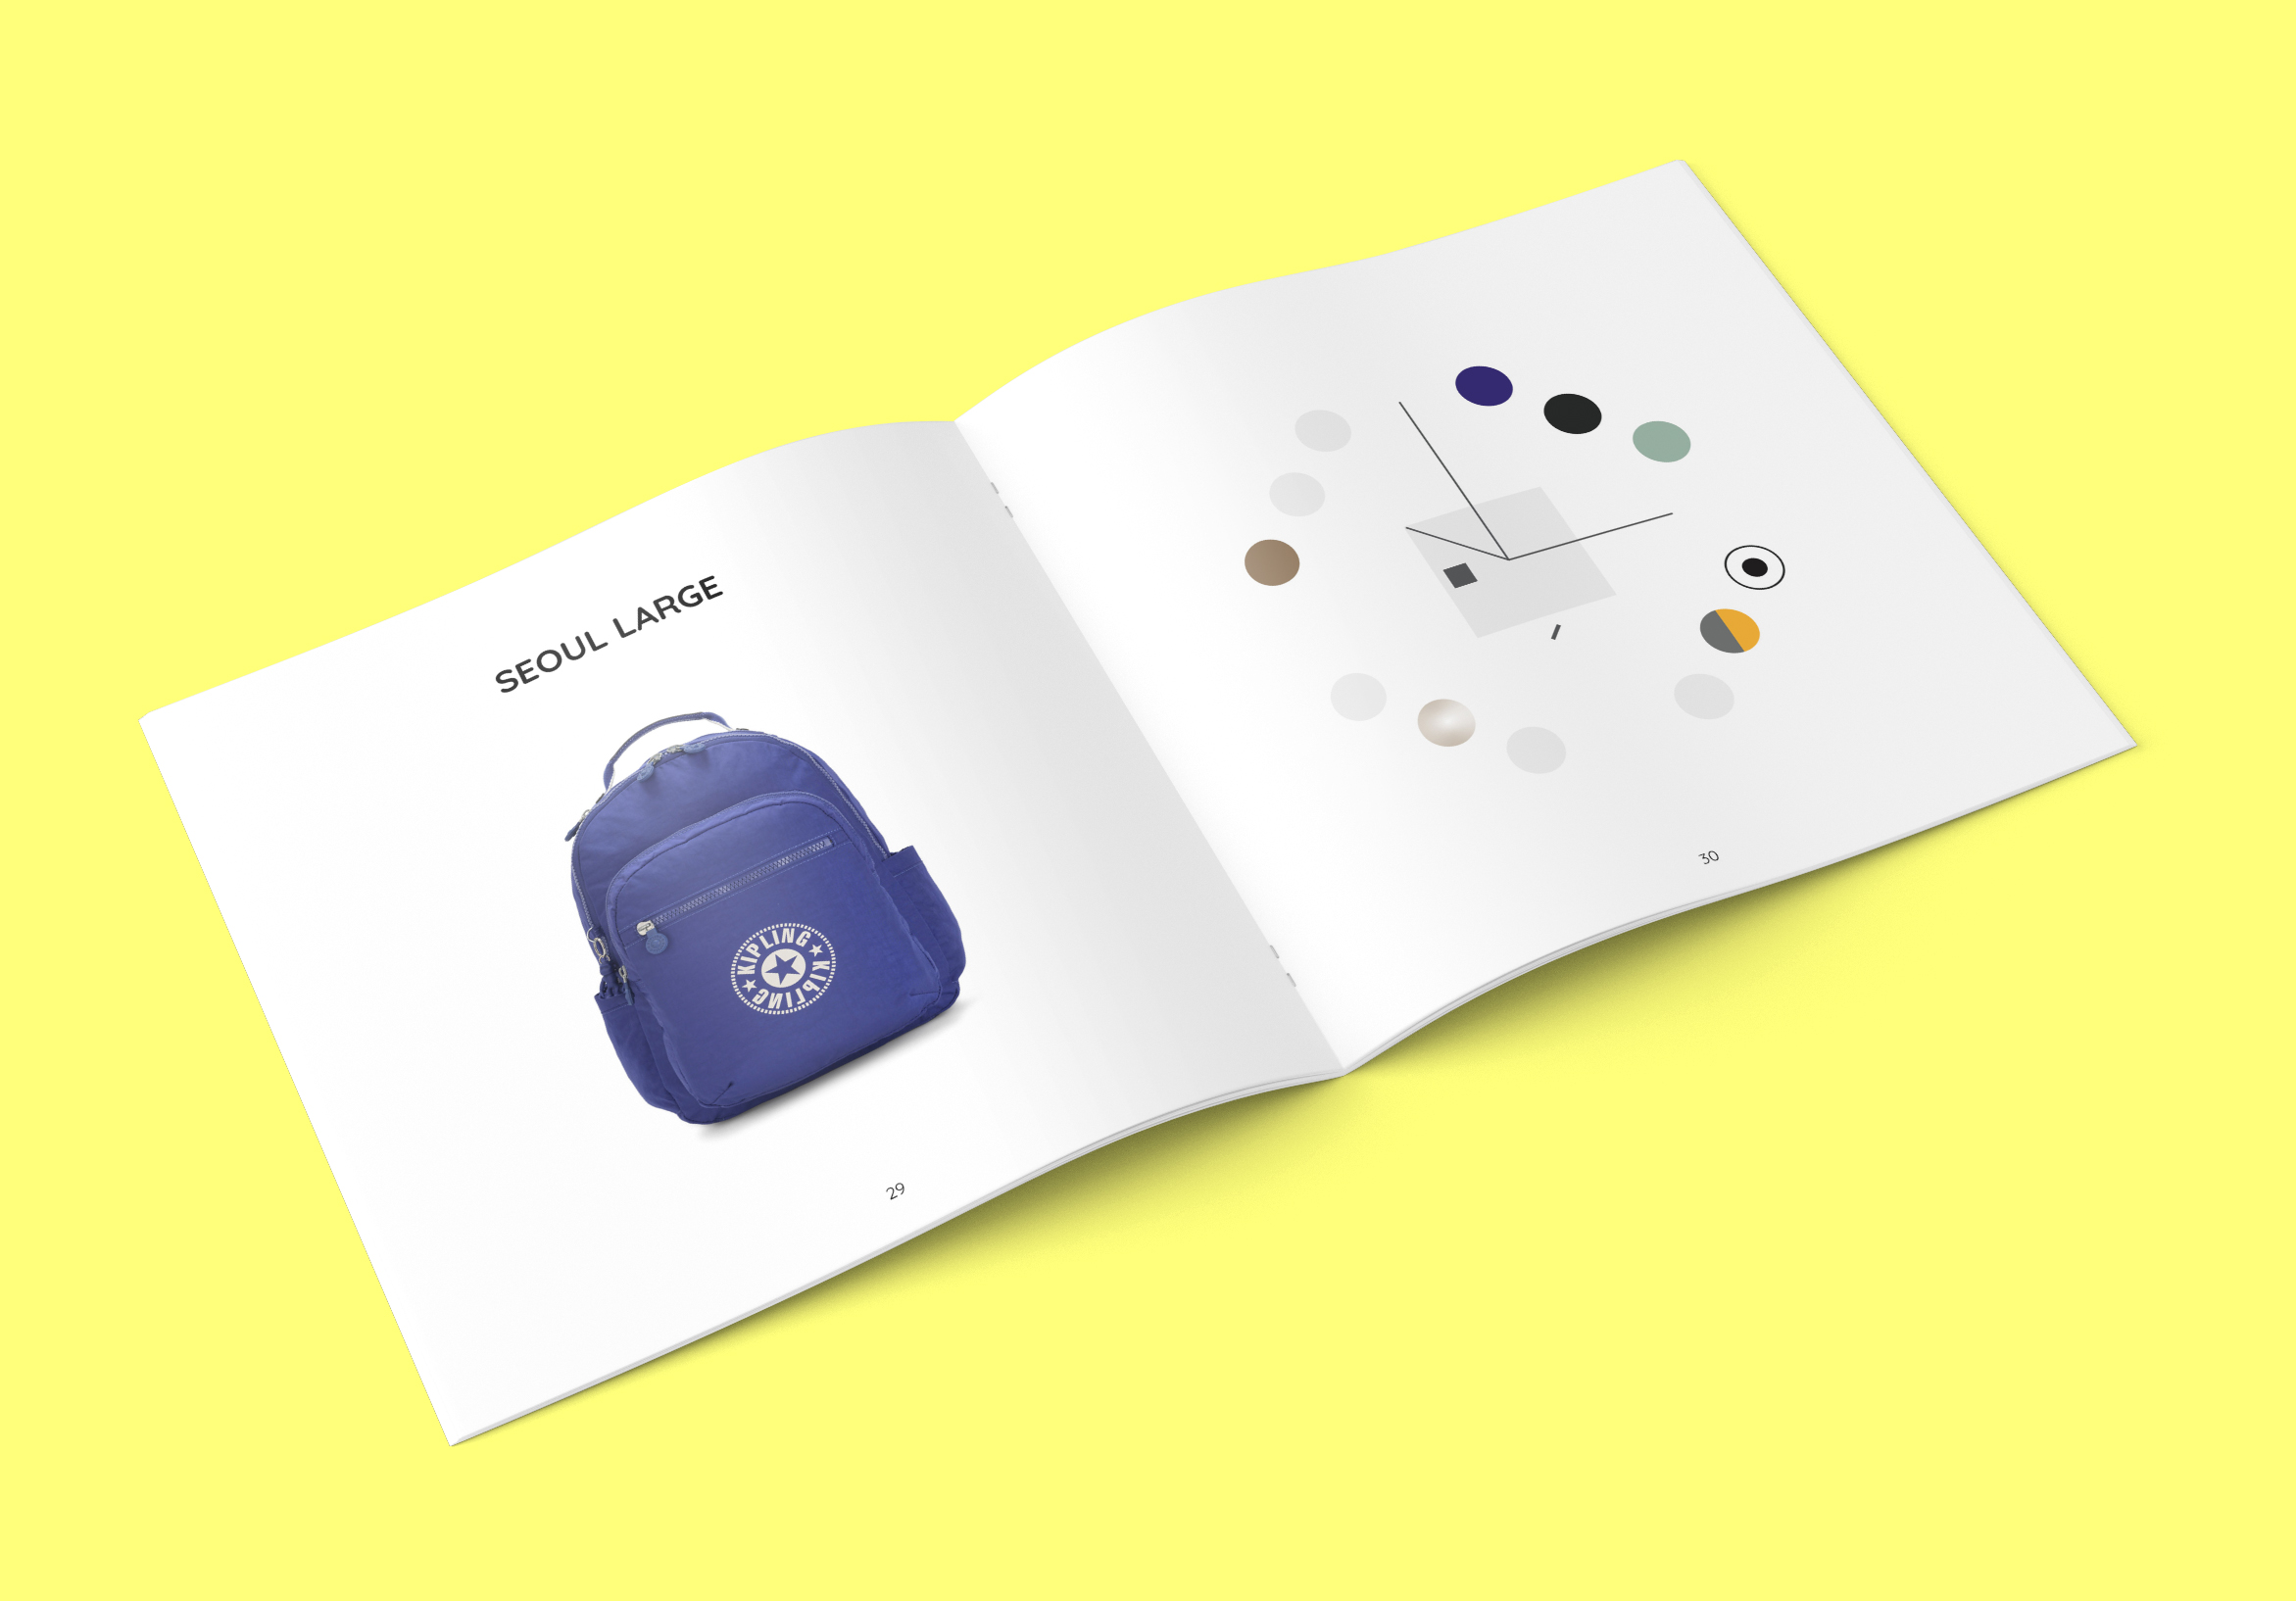
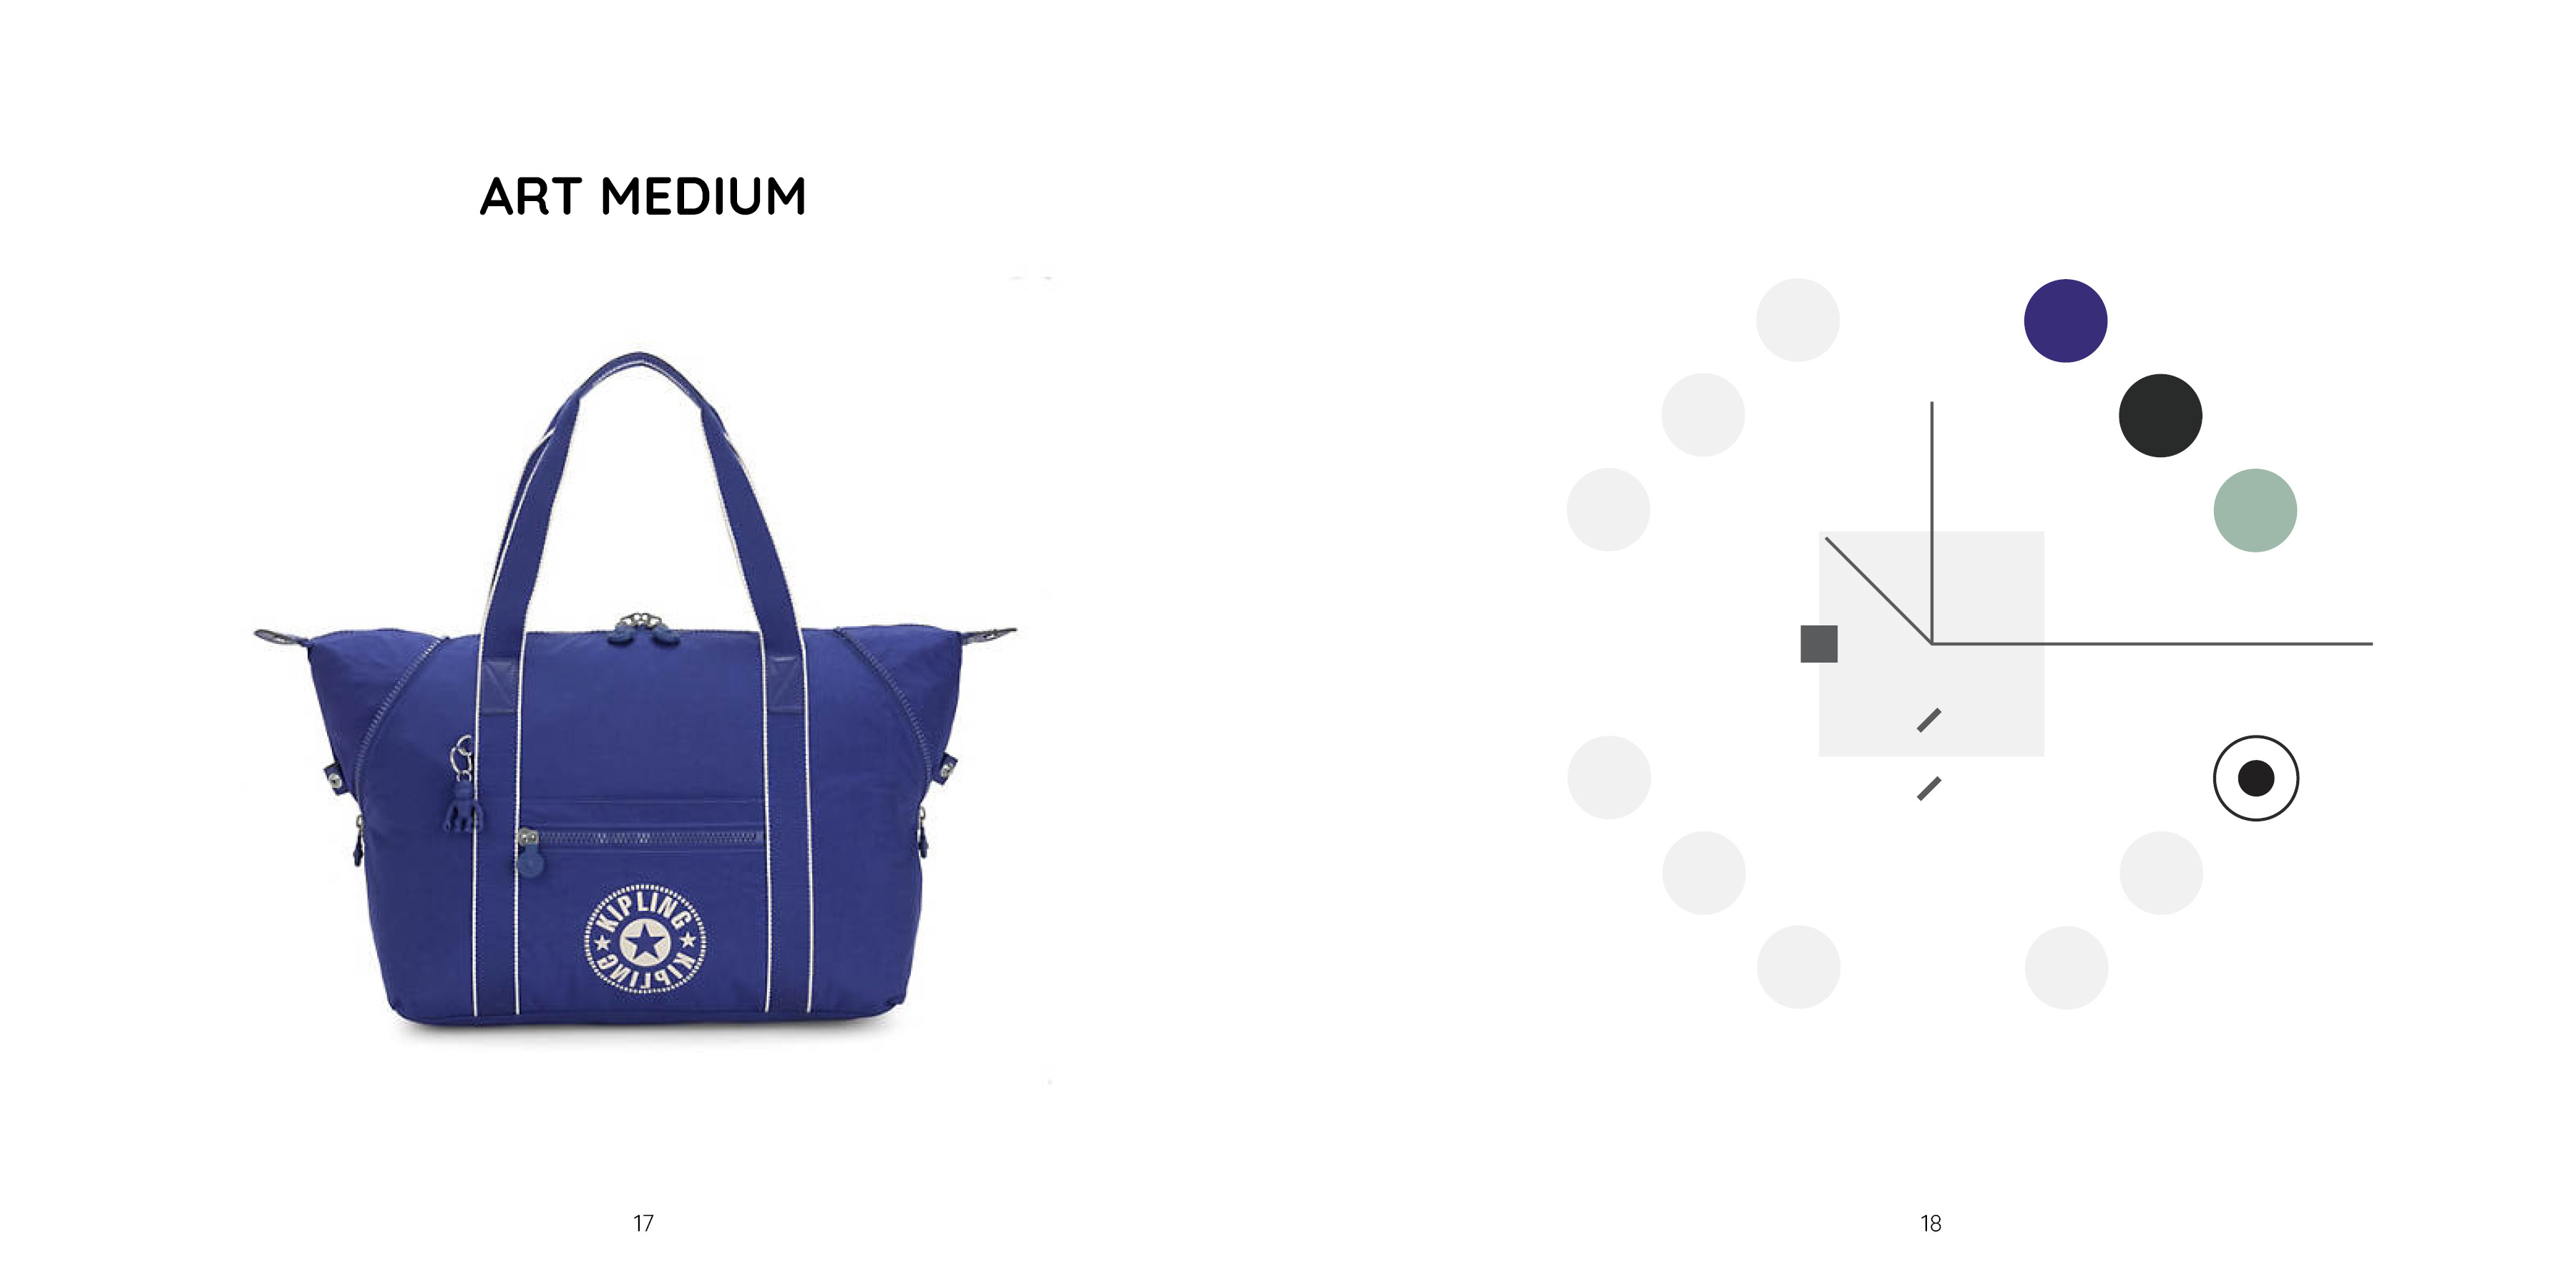
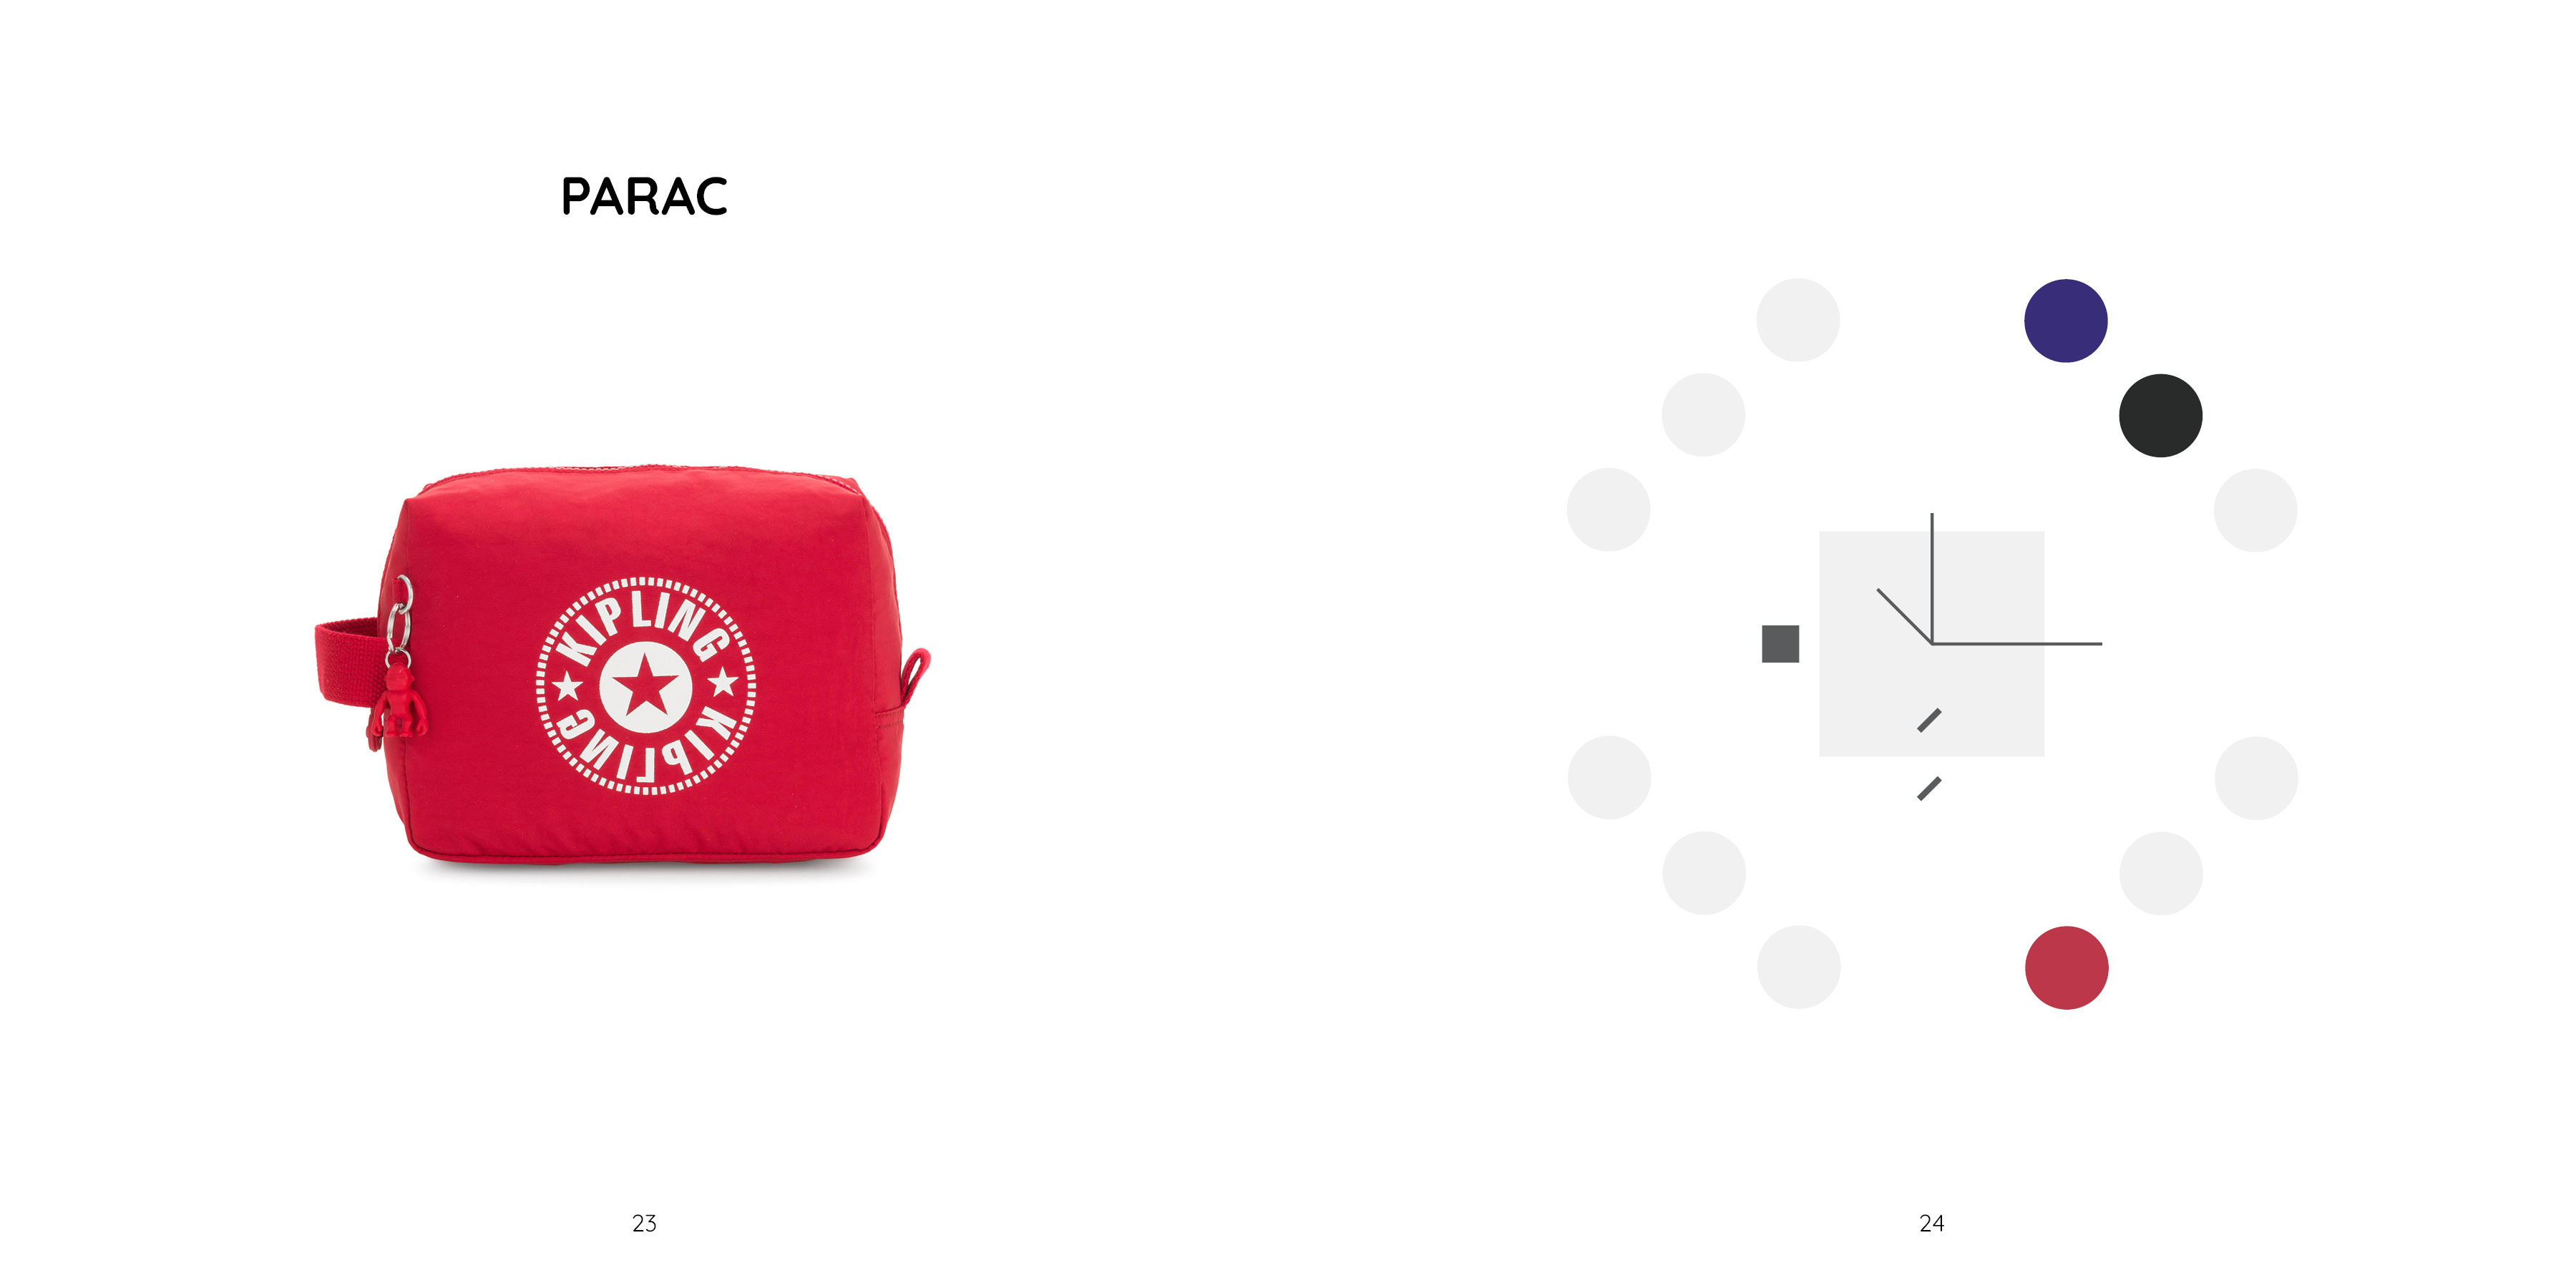
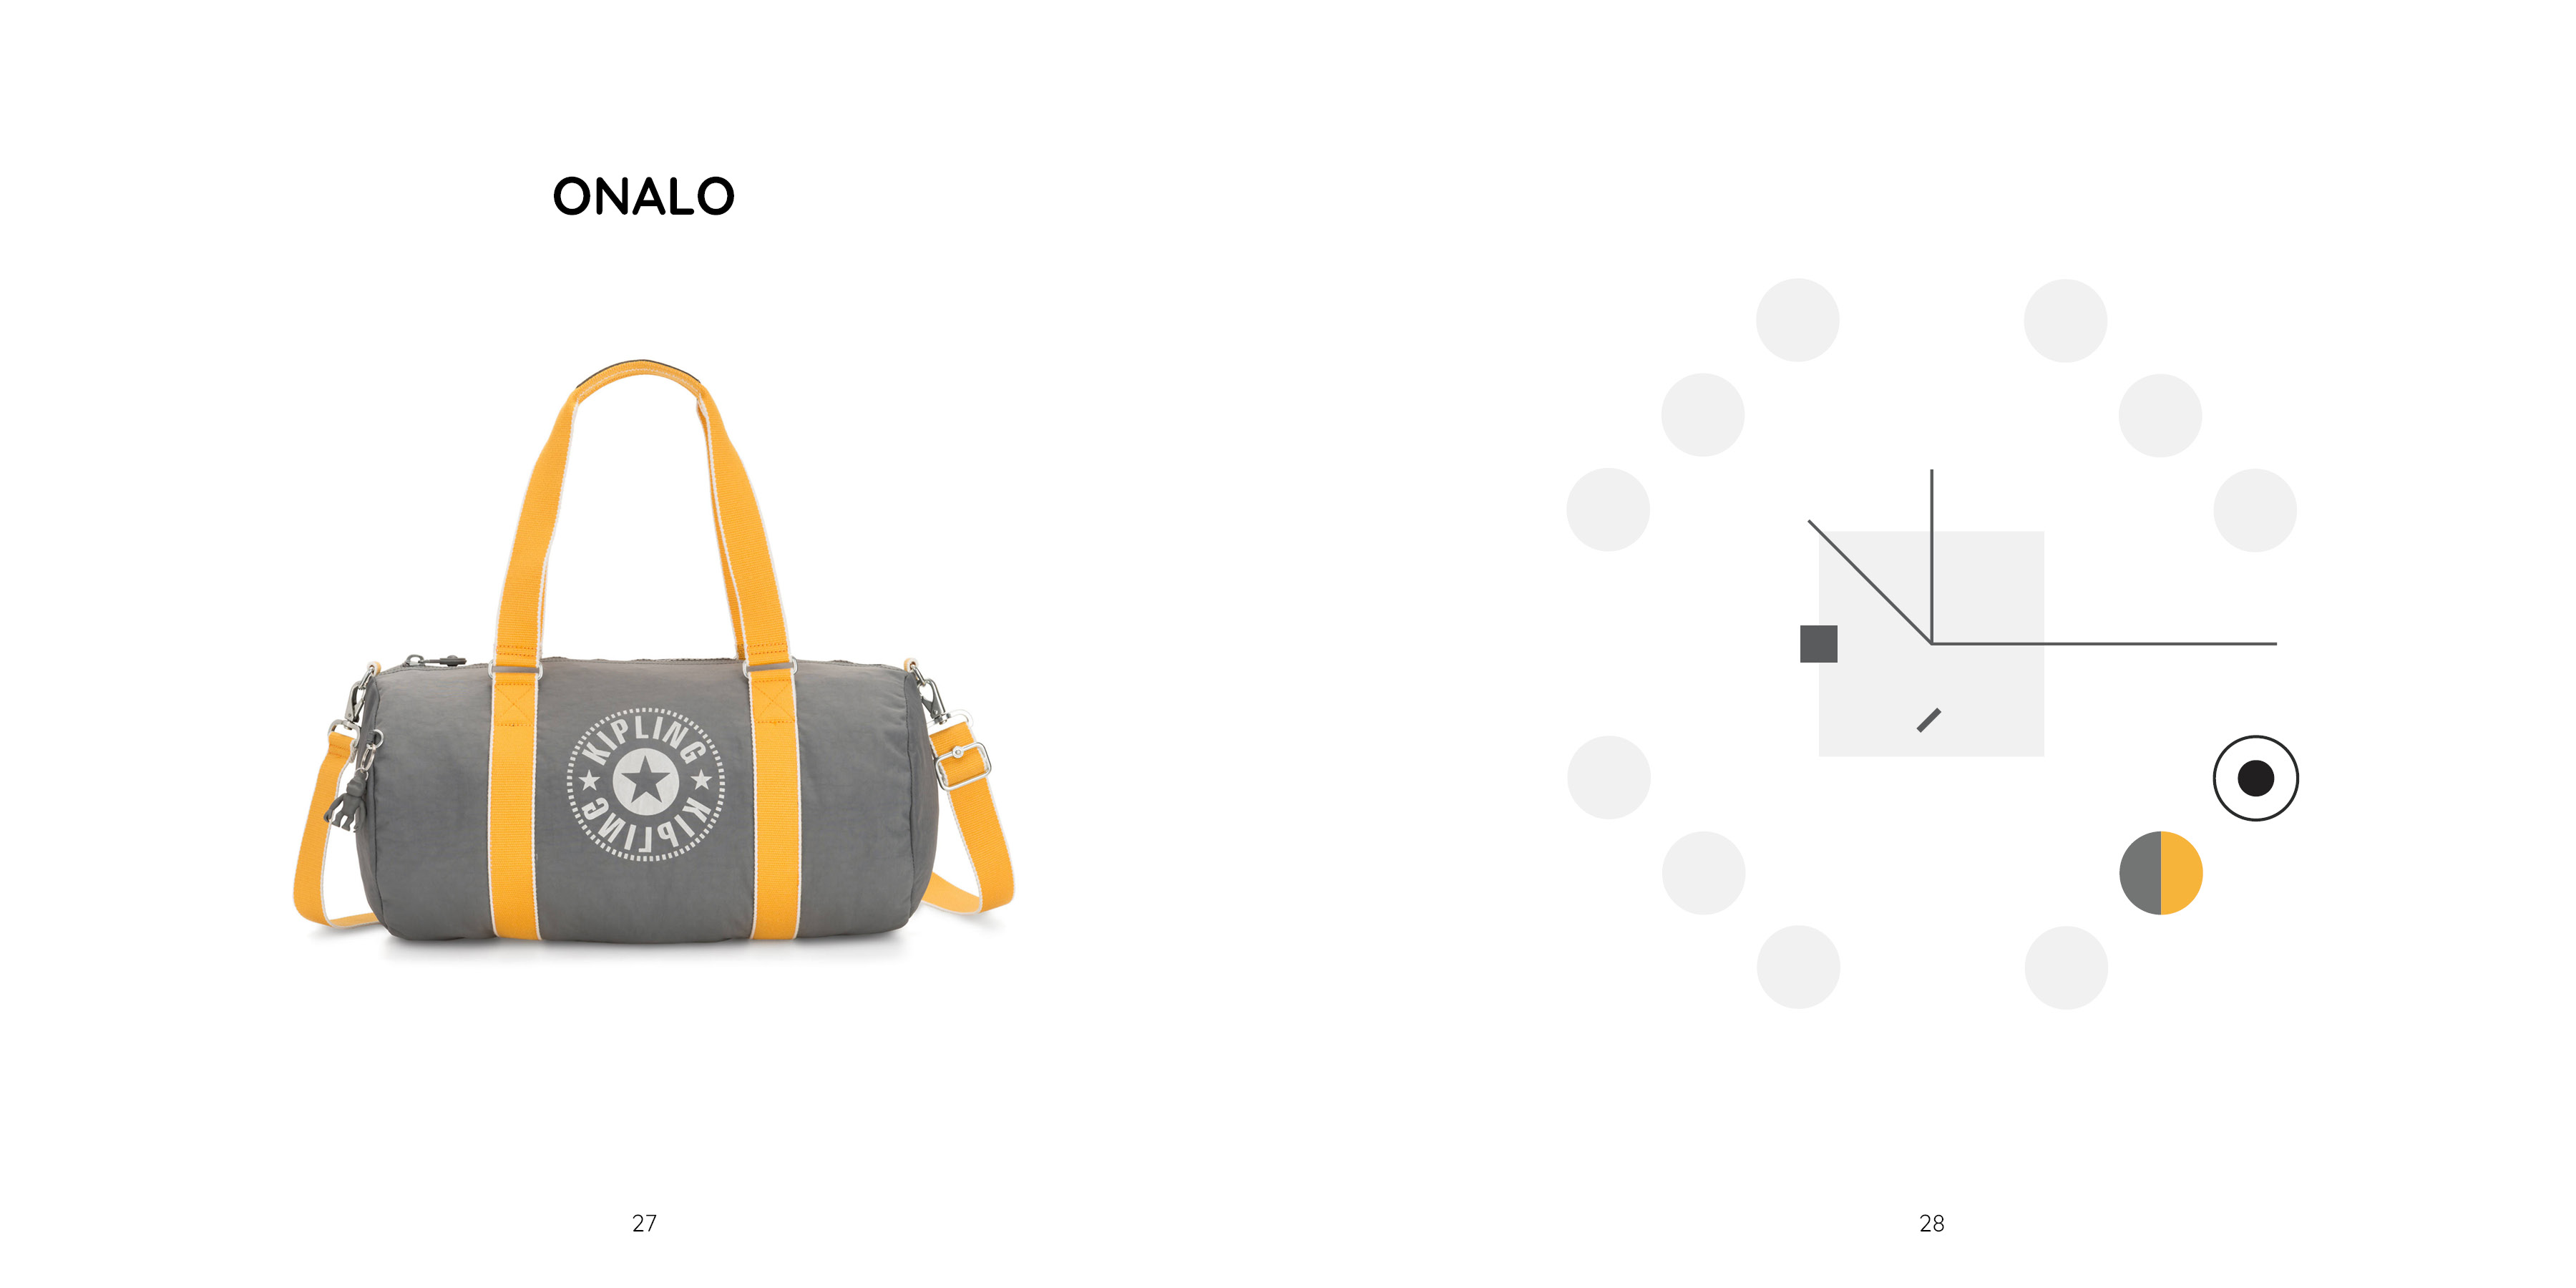
I collected data on all the products in the NEW CLASSICS line in MS Excel. I identified 11 product types and I made a list of attributes that help customers make a purchase. Attributes include size, weight, colour, type of bag, and pocket compartments. From this list, I chose four key attributes for each bag to show in the data visualizations:
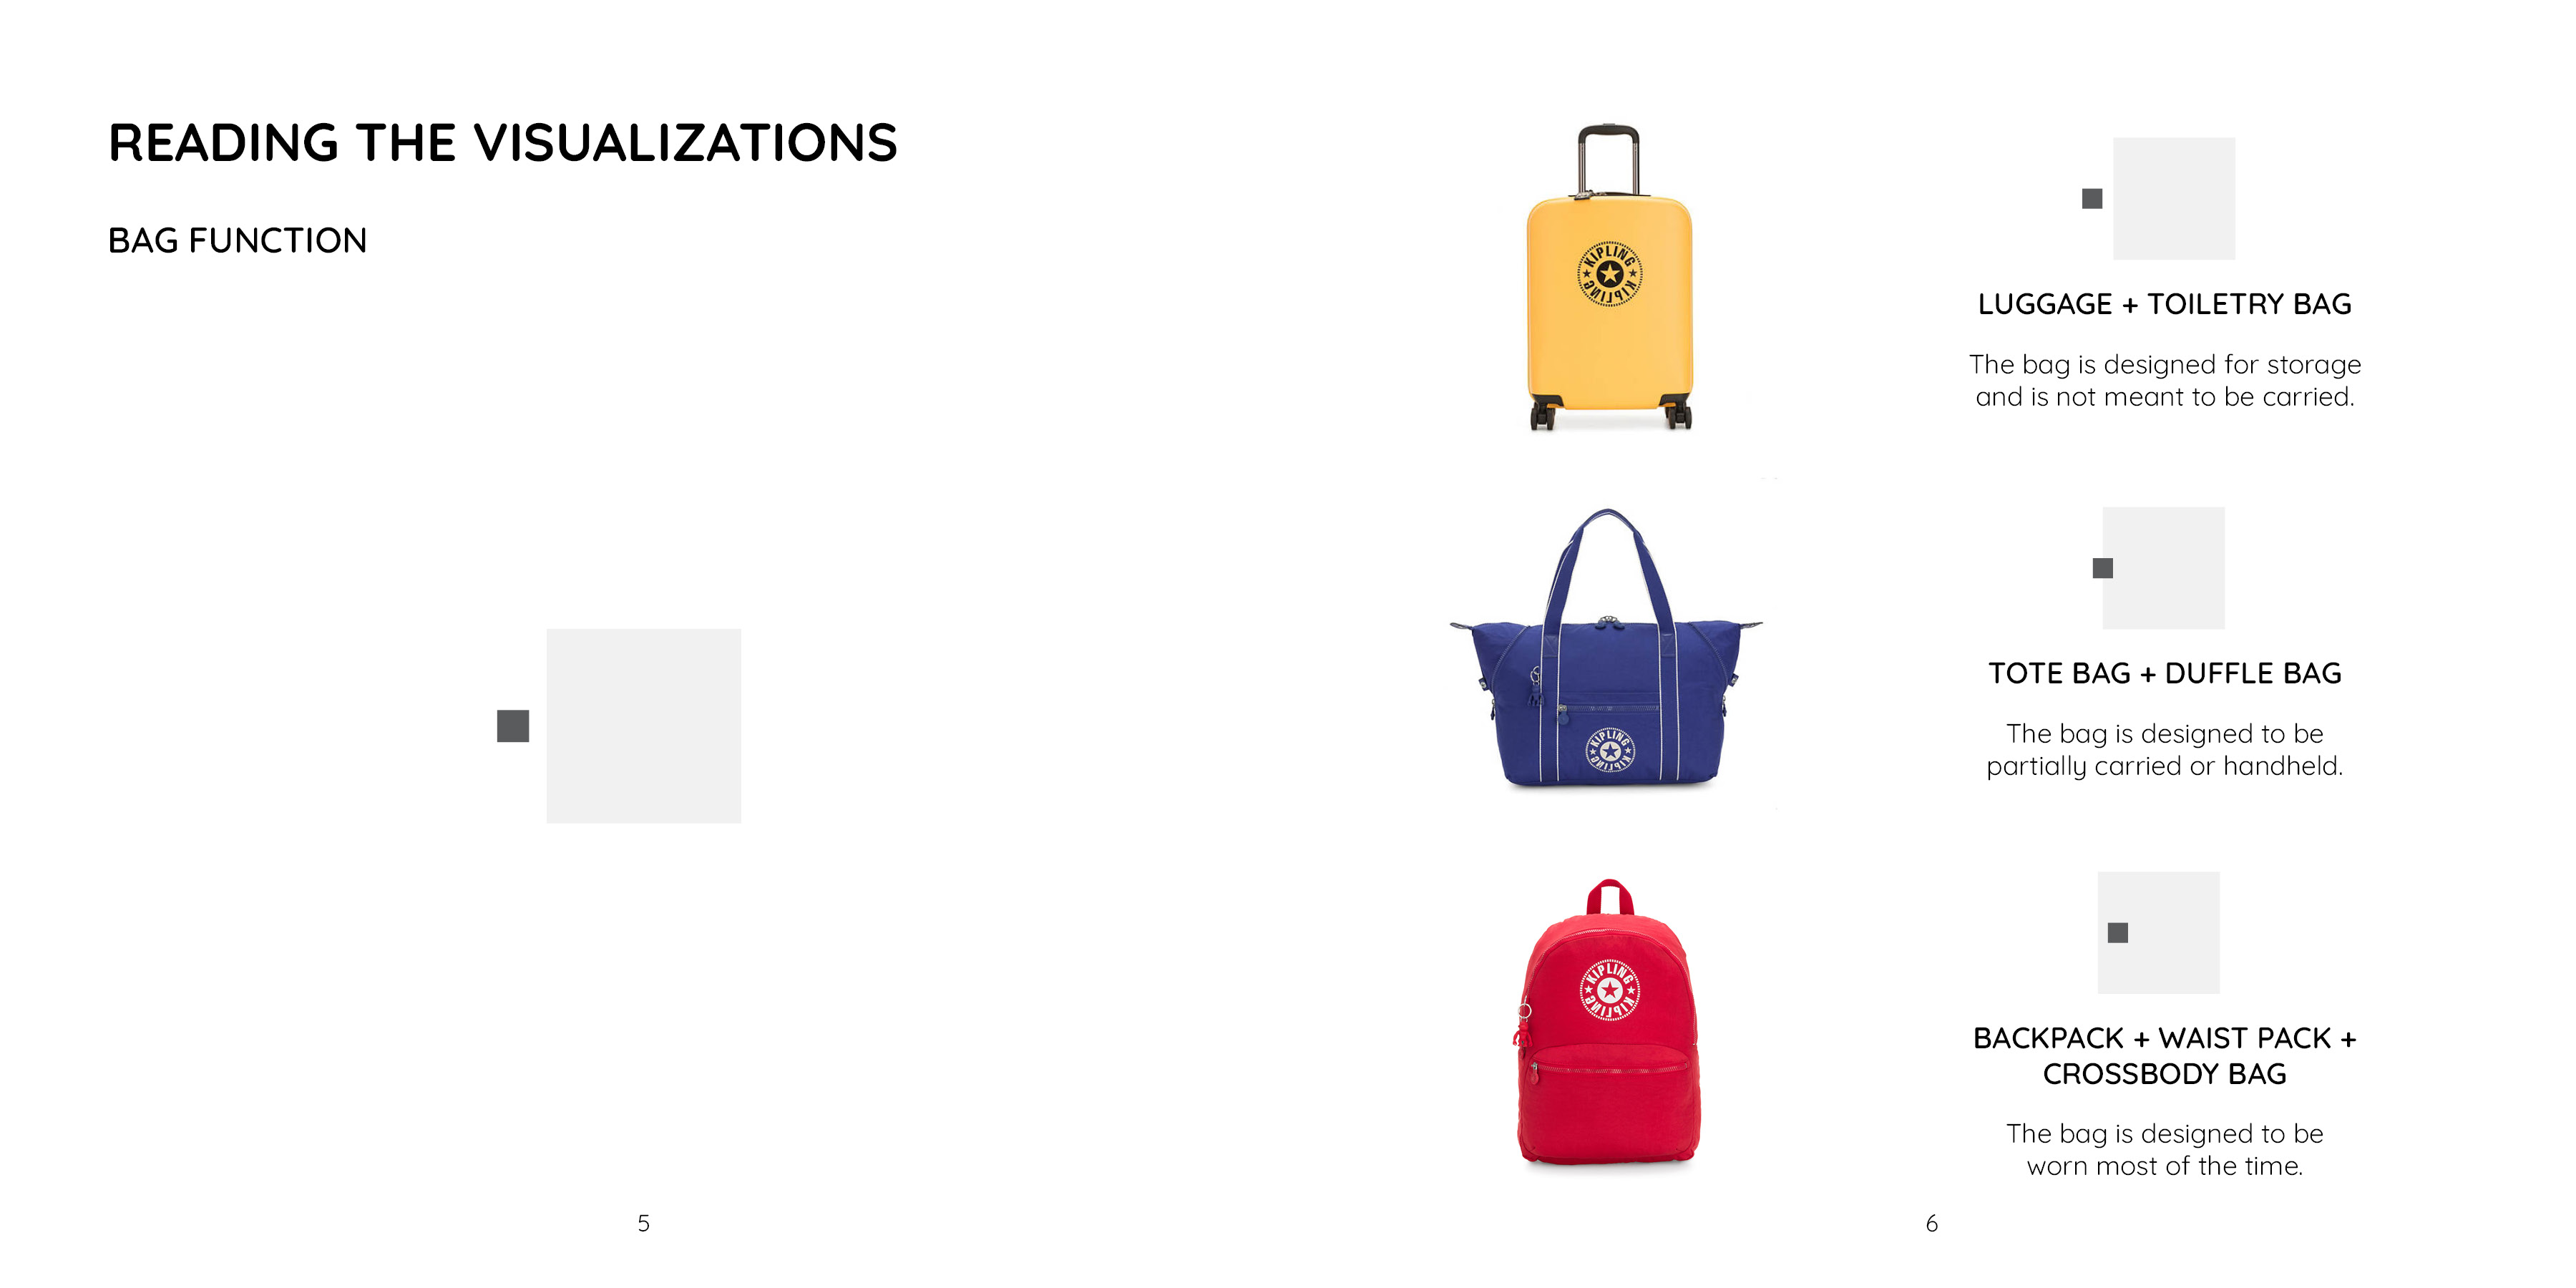
- Bag function: is this bag meant to be worn all the time? Maybe it’s meant for storage or only be partially worn.
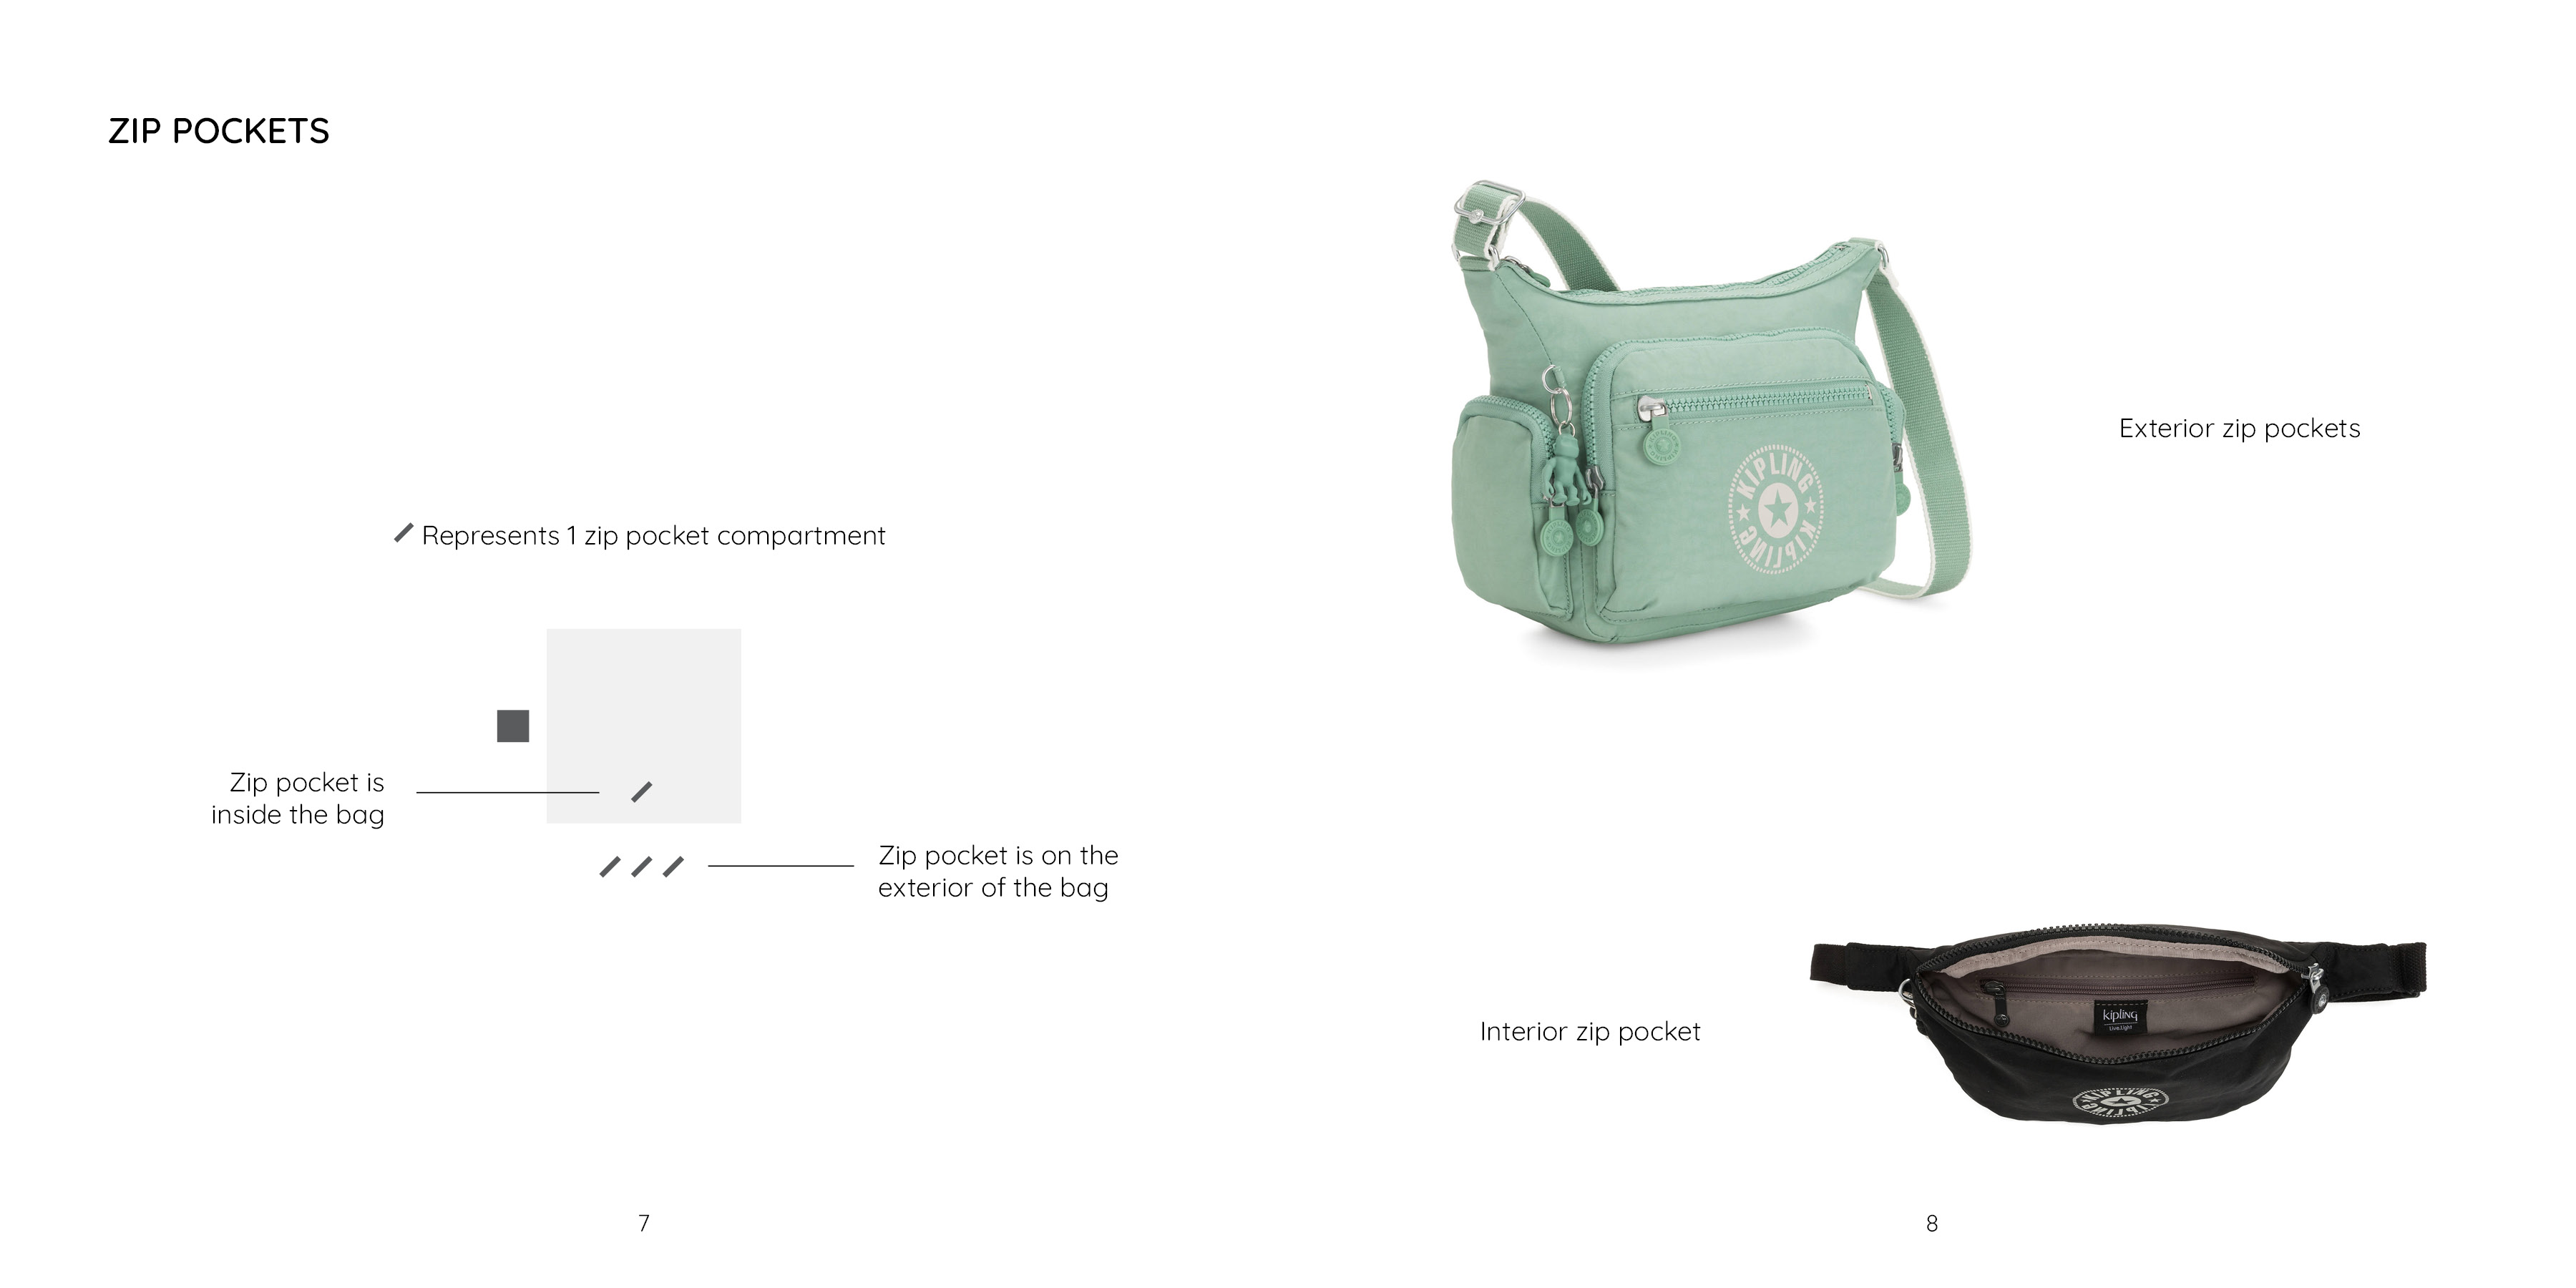
- Zip pockets: the number of internal and external zip pockets on the bag. It’s not something that’s easy to see in product photos, so I visualized it to make it more obvious.
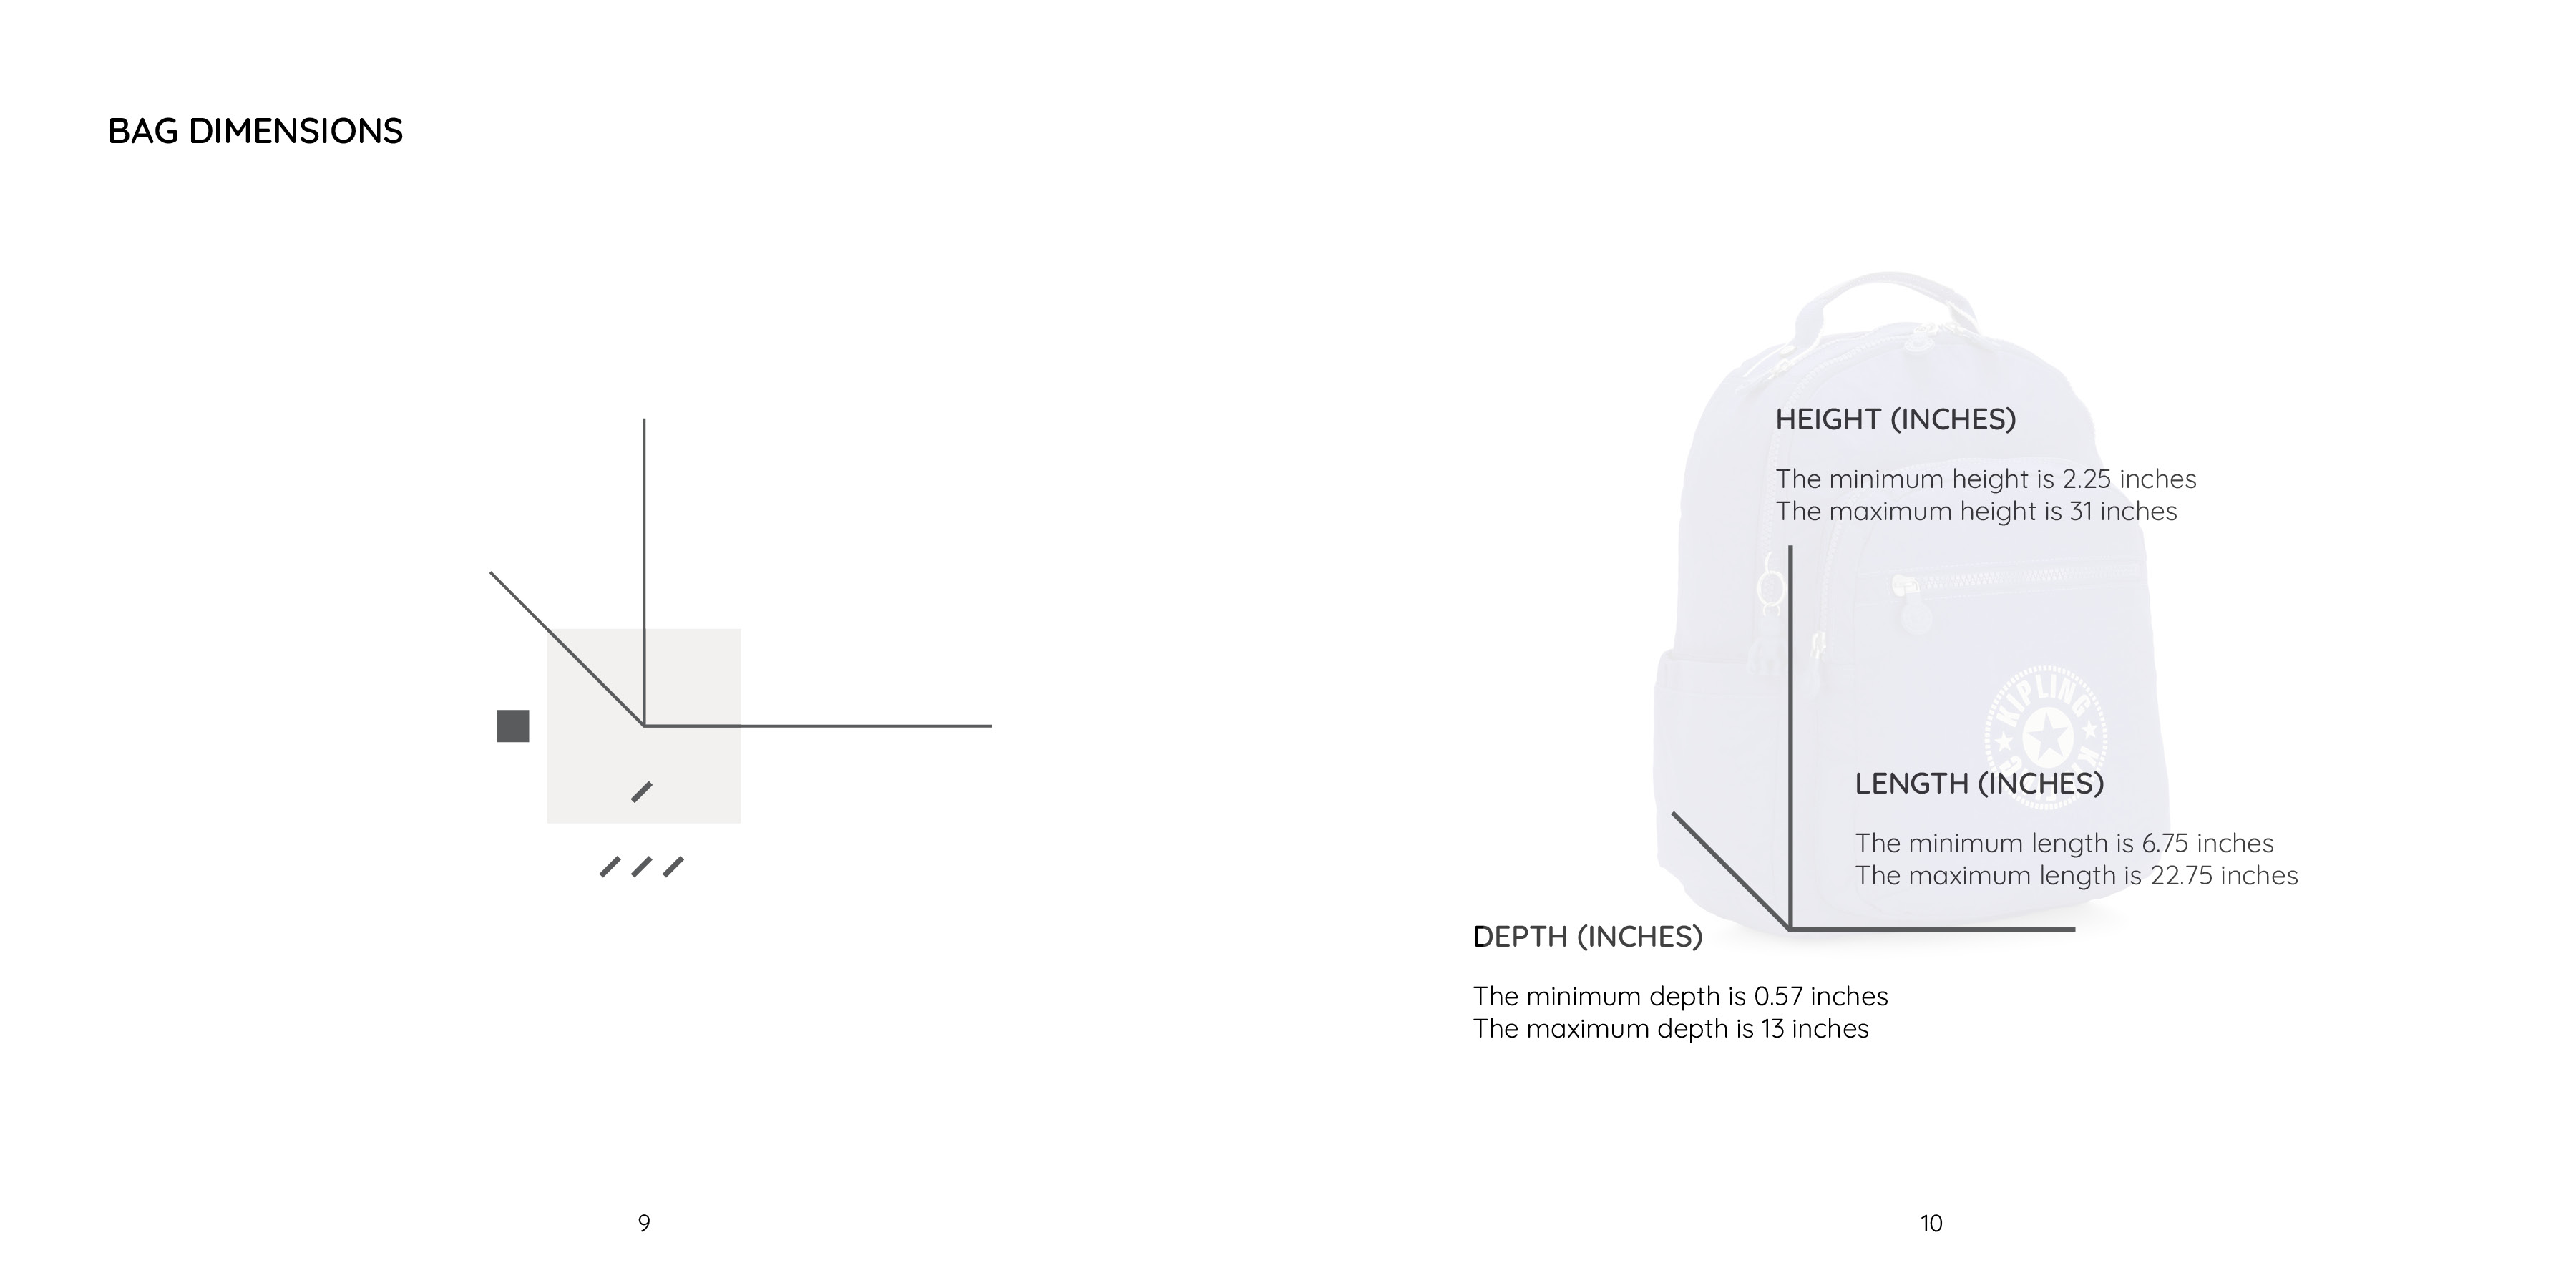
- Bag dimensions: the dimensions are hard to relate, so they are all scaled relative to each other to show sizes.
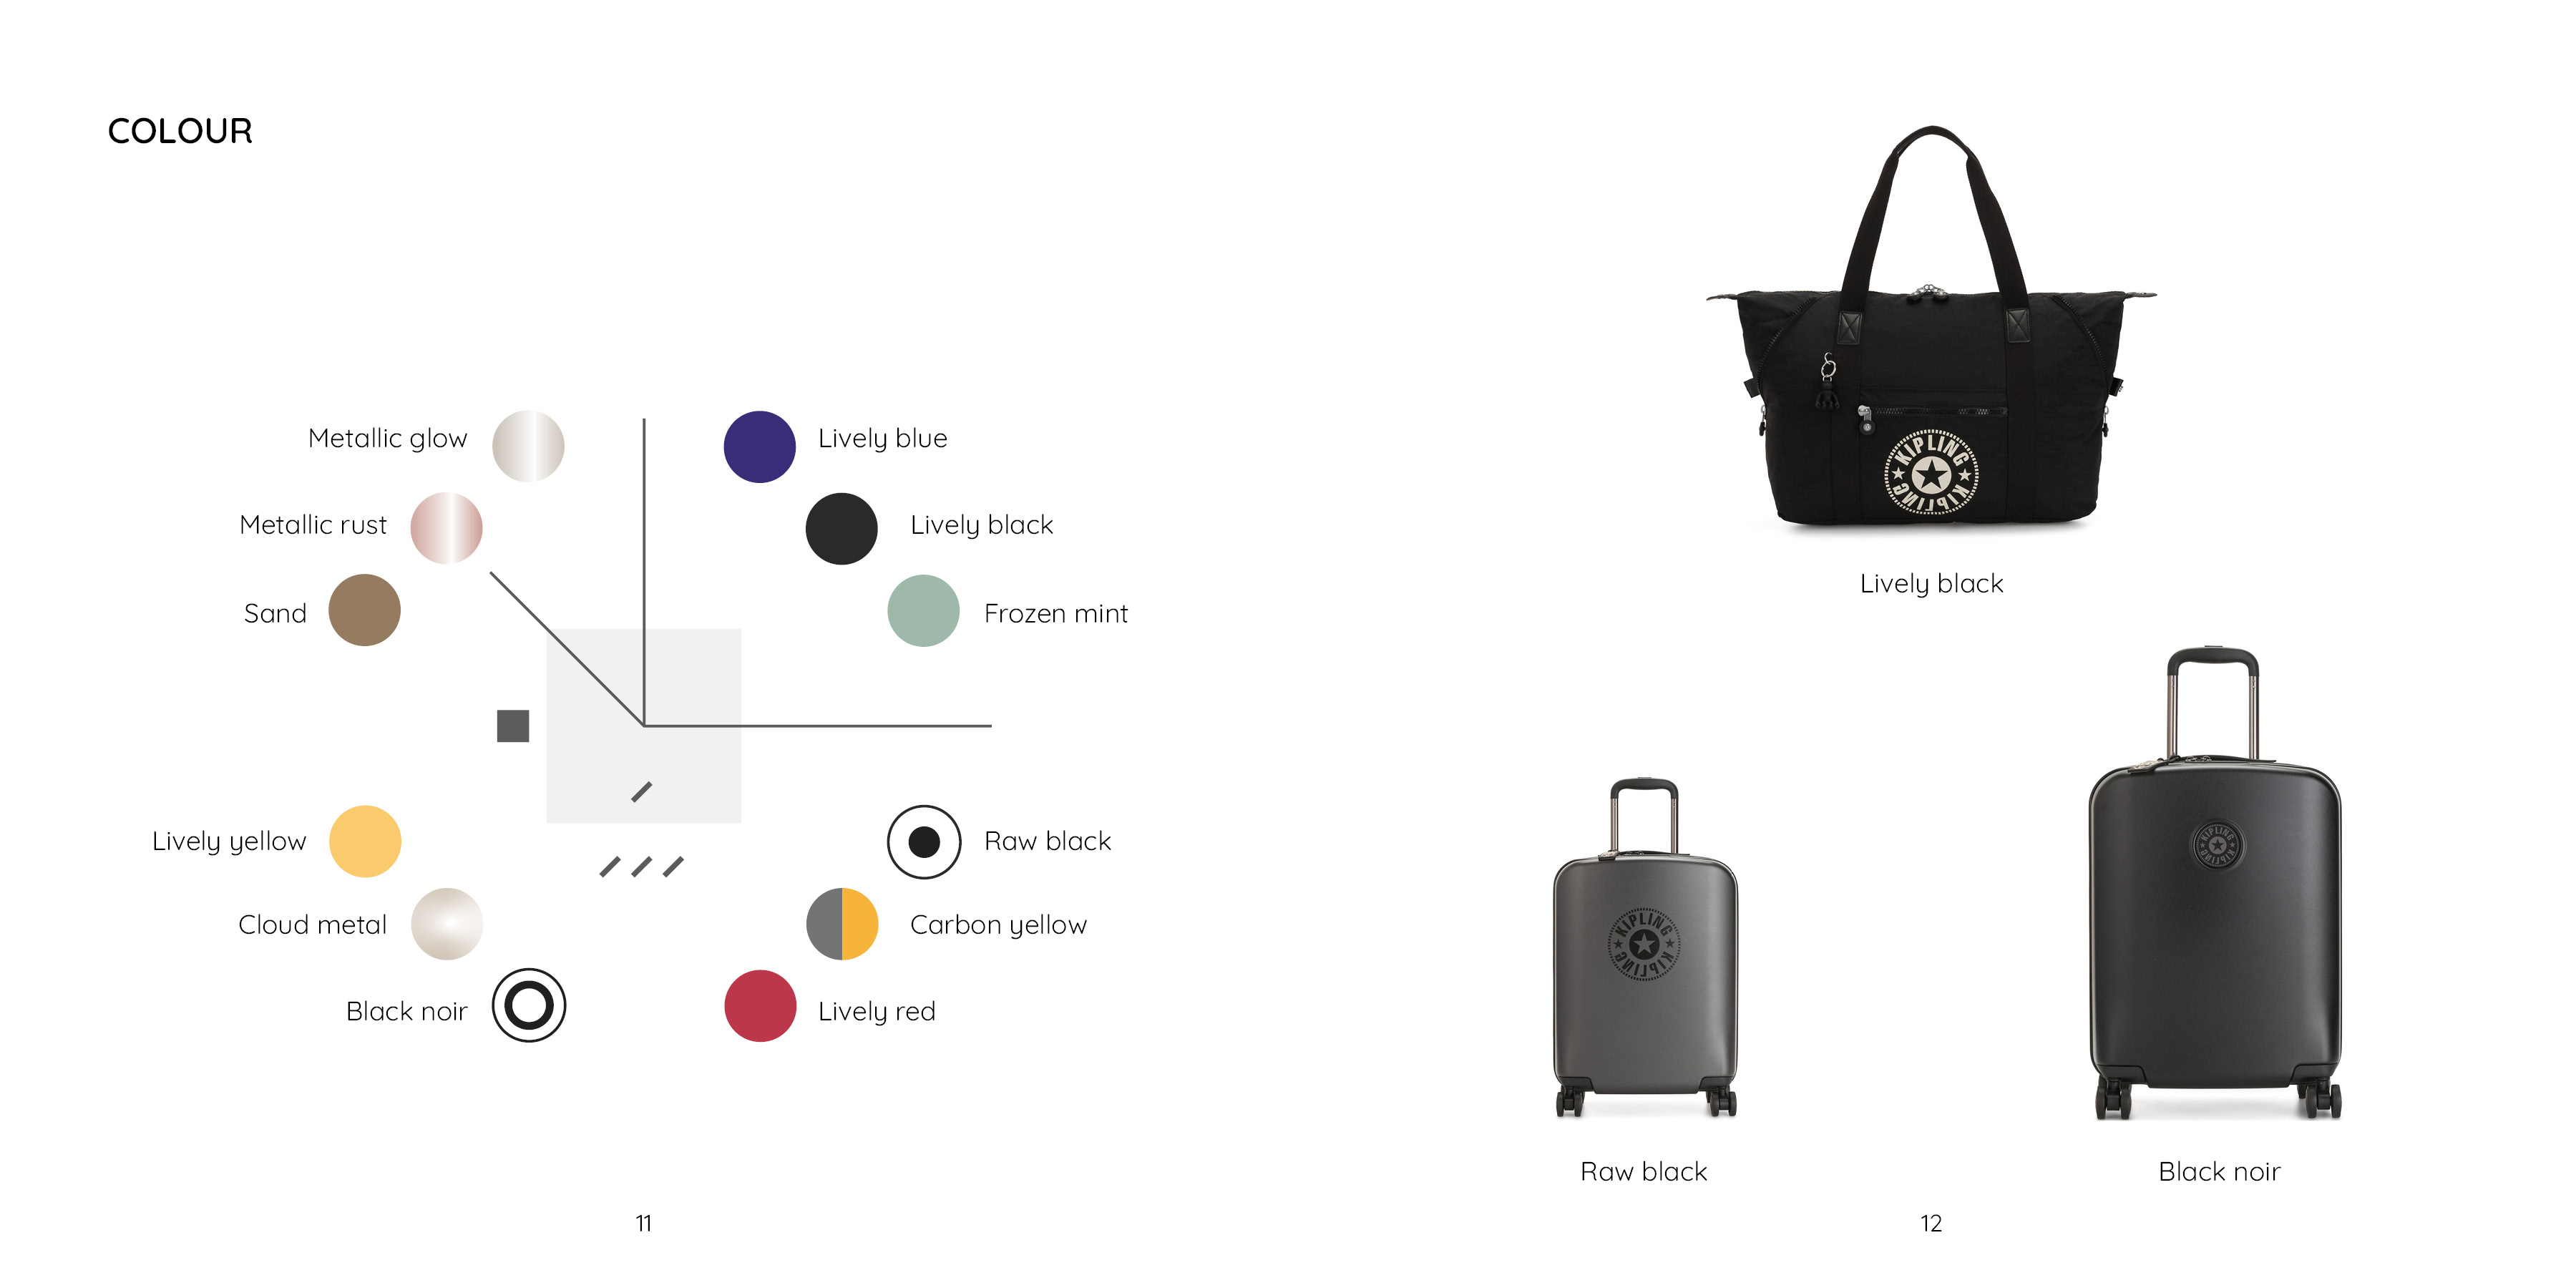
- Colour: there are 12 colours in total in this collection.
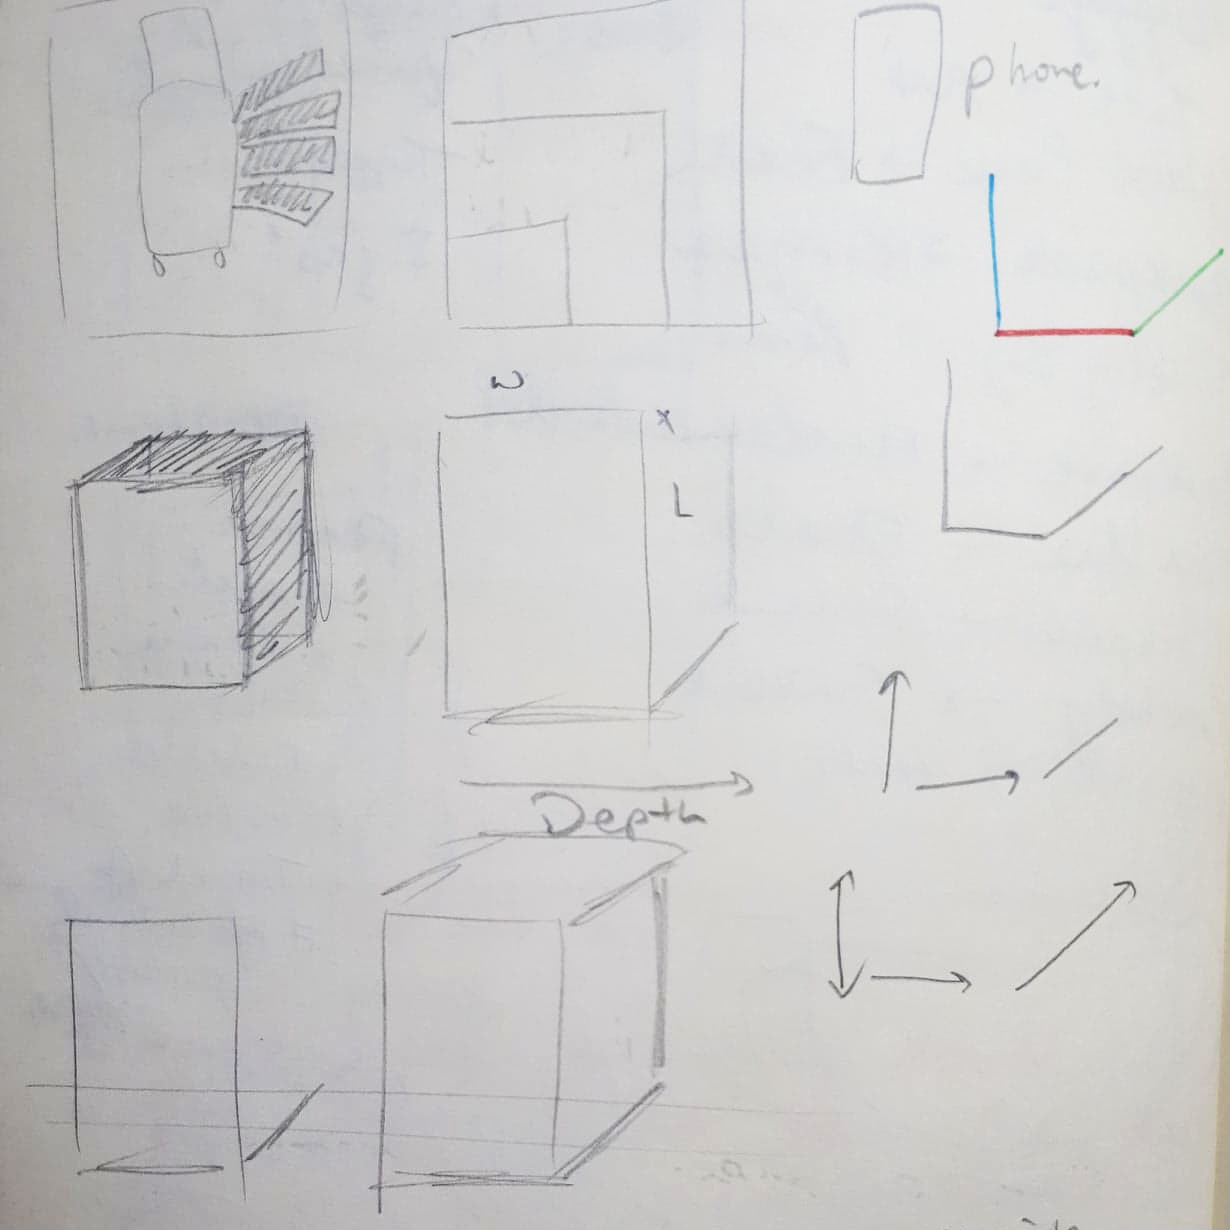
This initial sketch inspired the dimensions attribute. I drew perspective drawings to get to the idea.
This sketch was very close to the final result. I explored the bag function attribute with this.