Visualizing data in boardgame manuals
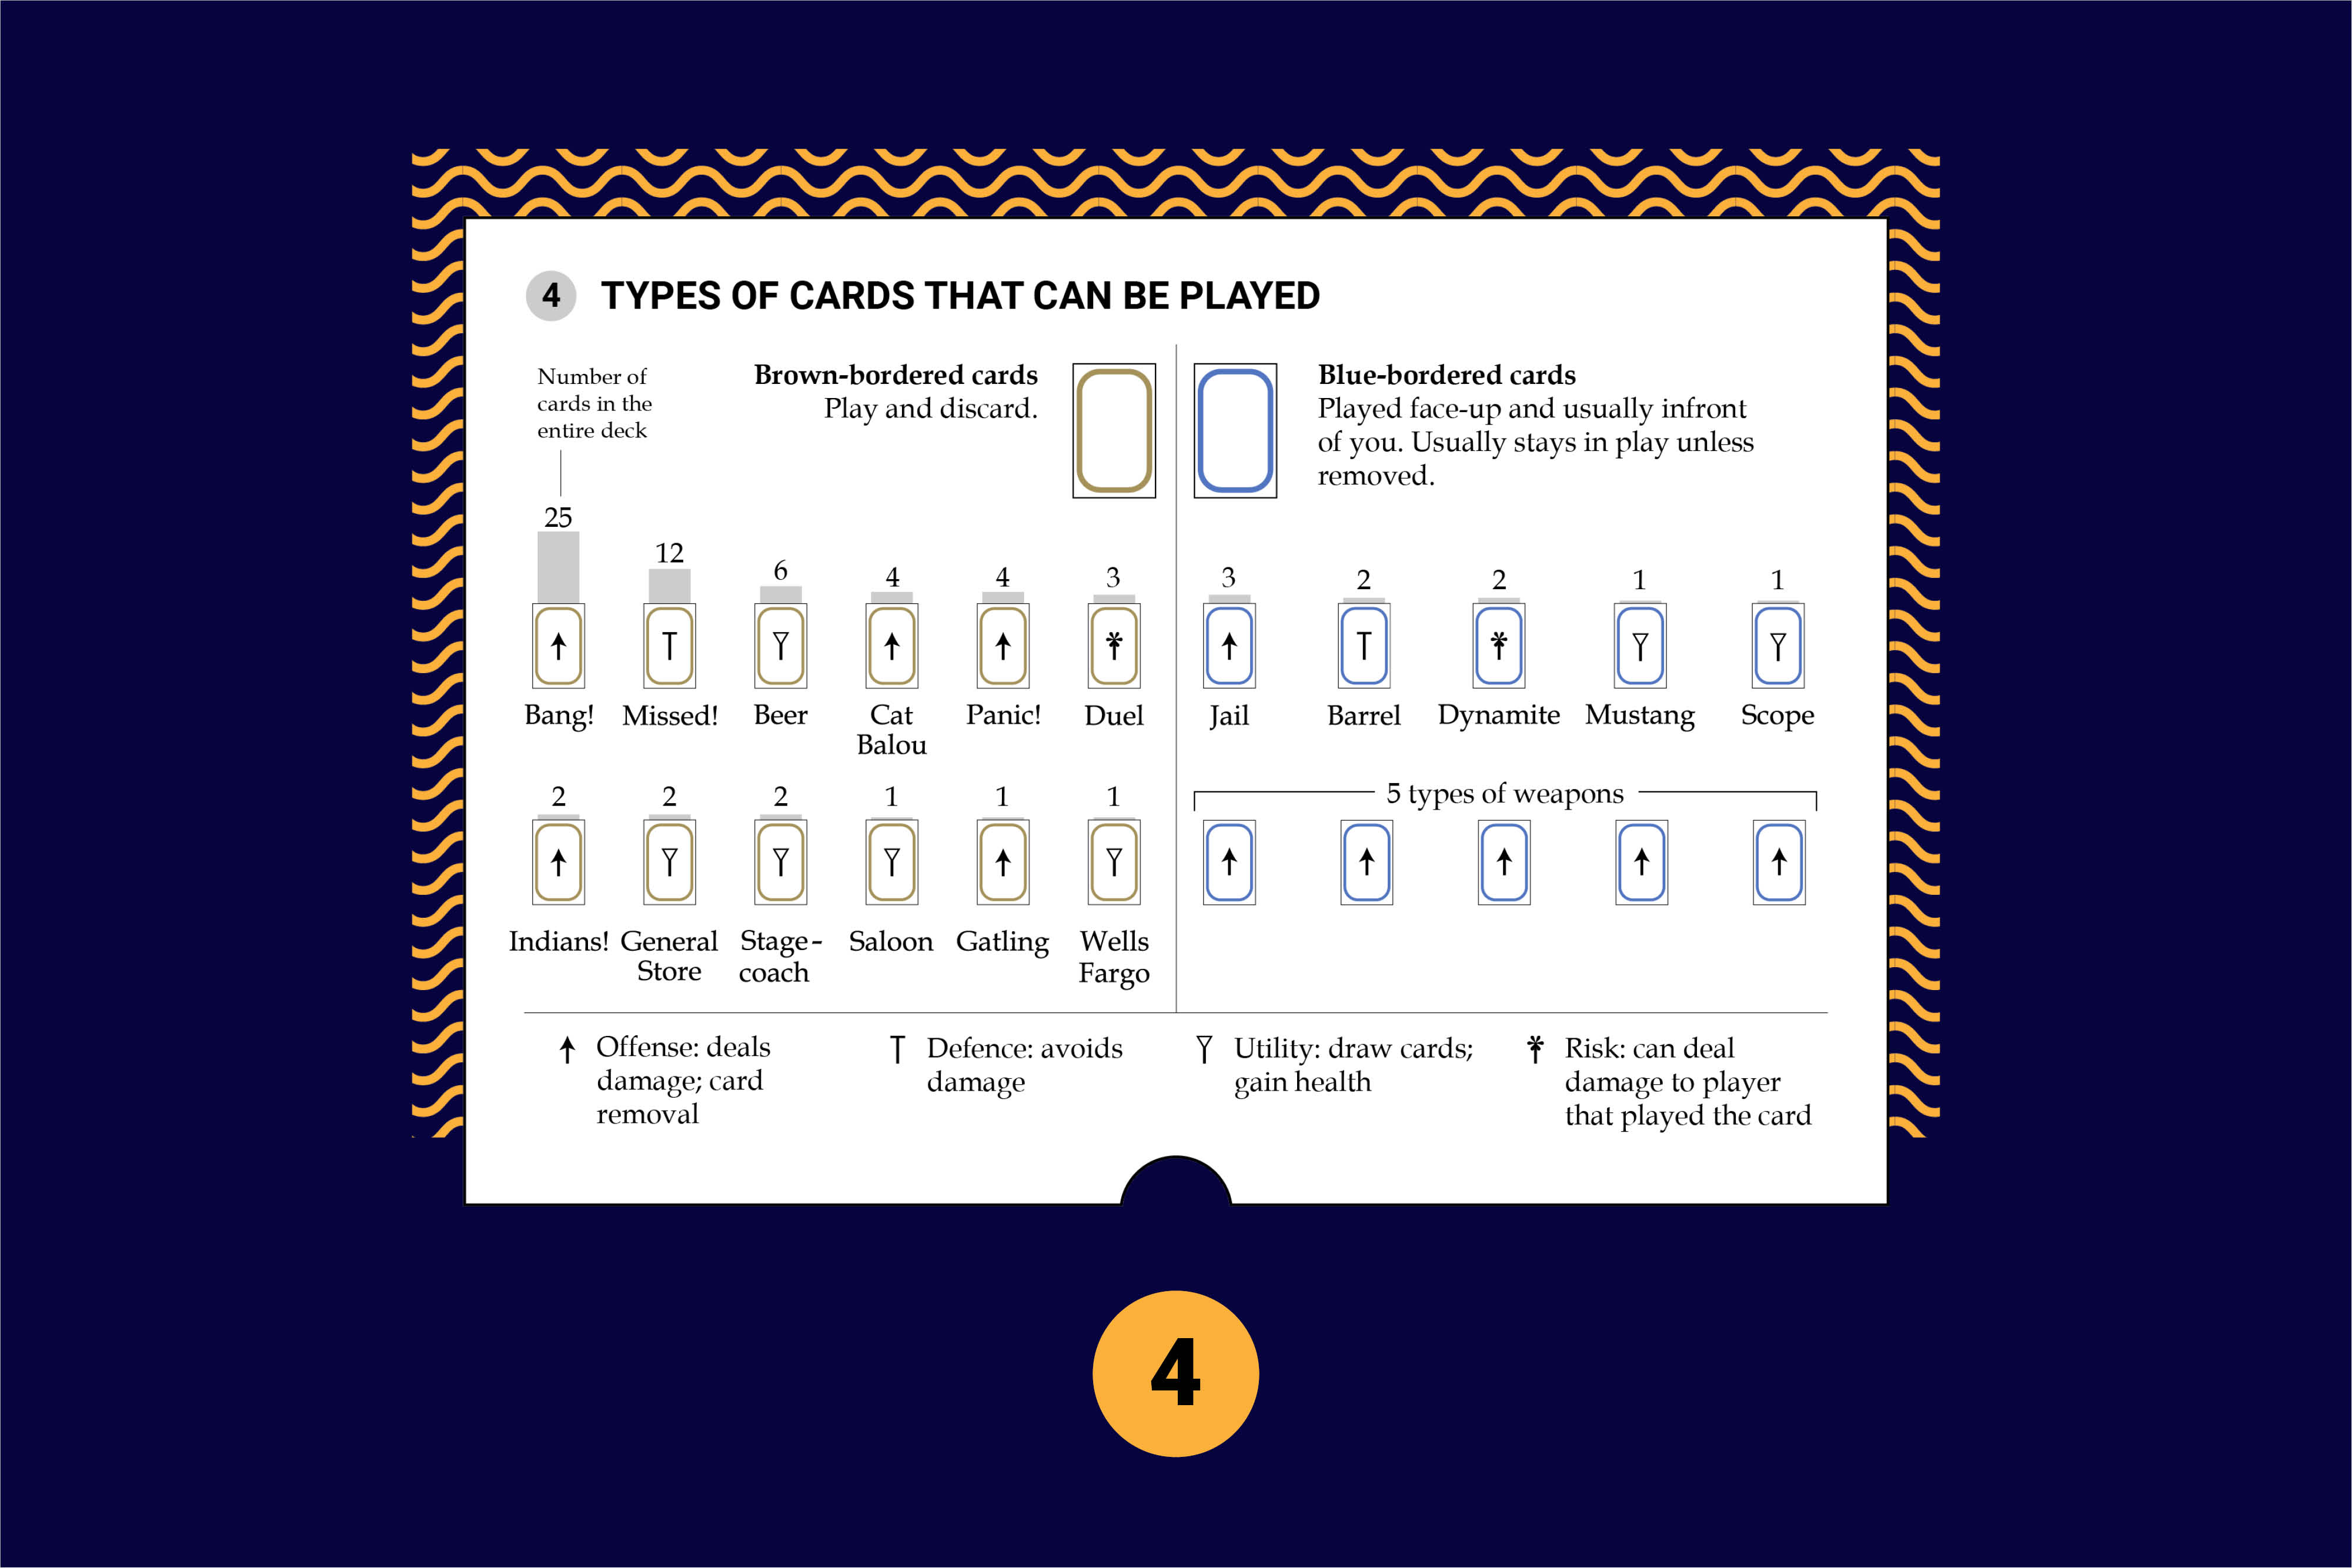
I visualized the board game manual from Bang! I’ve played Bang! over 100 times, but I never noticed the underlying mechanism that drove this game. Even the simple act of creating a histogram of all the cards in the deck gives insight to the value of certain cards due to scarcity.
Brief
Problem being solved: Game manuals are usually filled with walls of text to teach players how to play a game. In my own experience, players usually learn how to play table top games from more experienced players. D&D, Magic the Gathering, Settlers of Catan, Monopoly, it’s quite rare that someone would dive into these games without an experienced player guiding them. Game manuals are designed to teach first-time players how to play, but they aren’t very effective at aiding an experienced player teaching a beginner. This project aims to target this teaching process while revealing the mechanics of the game.
Target audience: Experienced players teaching beginners how to play Bang!
Key objective: To design a visual aid that could assist experienced players teaching the game to beginners. The visual aid would complement the game manual, not replace it. The aid would teach beginners the underlying mechanics of the game and teach them not only to play, but also how to think about the game. The desired outcome is for beginners to better understand how to develop tactics to win games.
Process
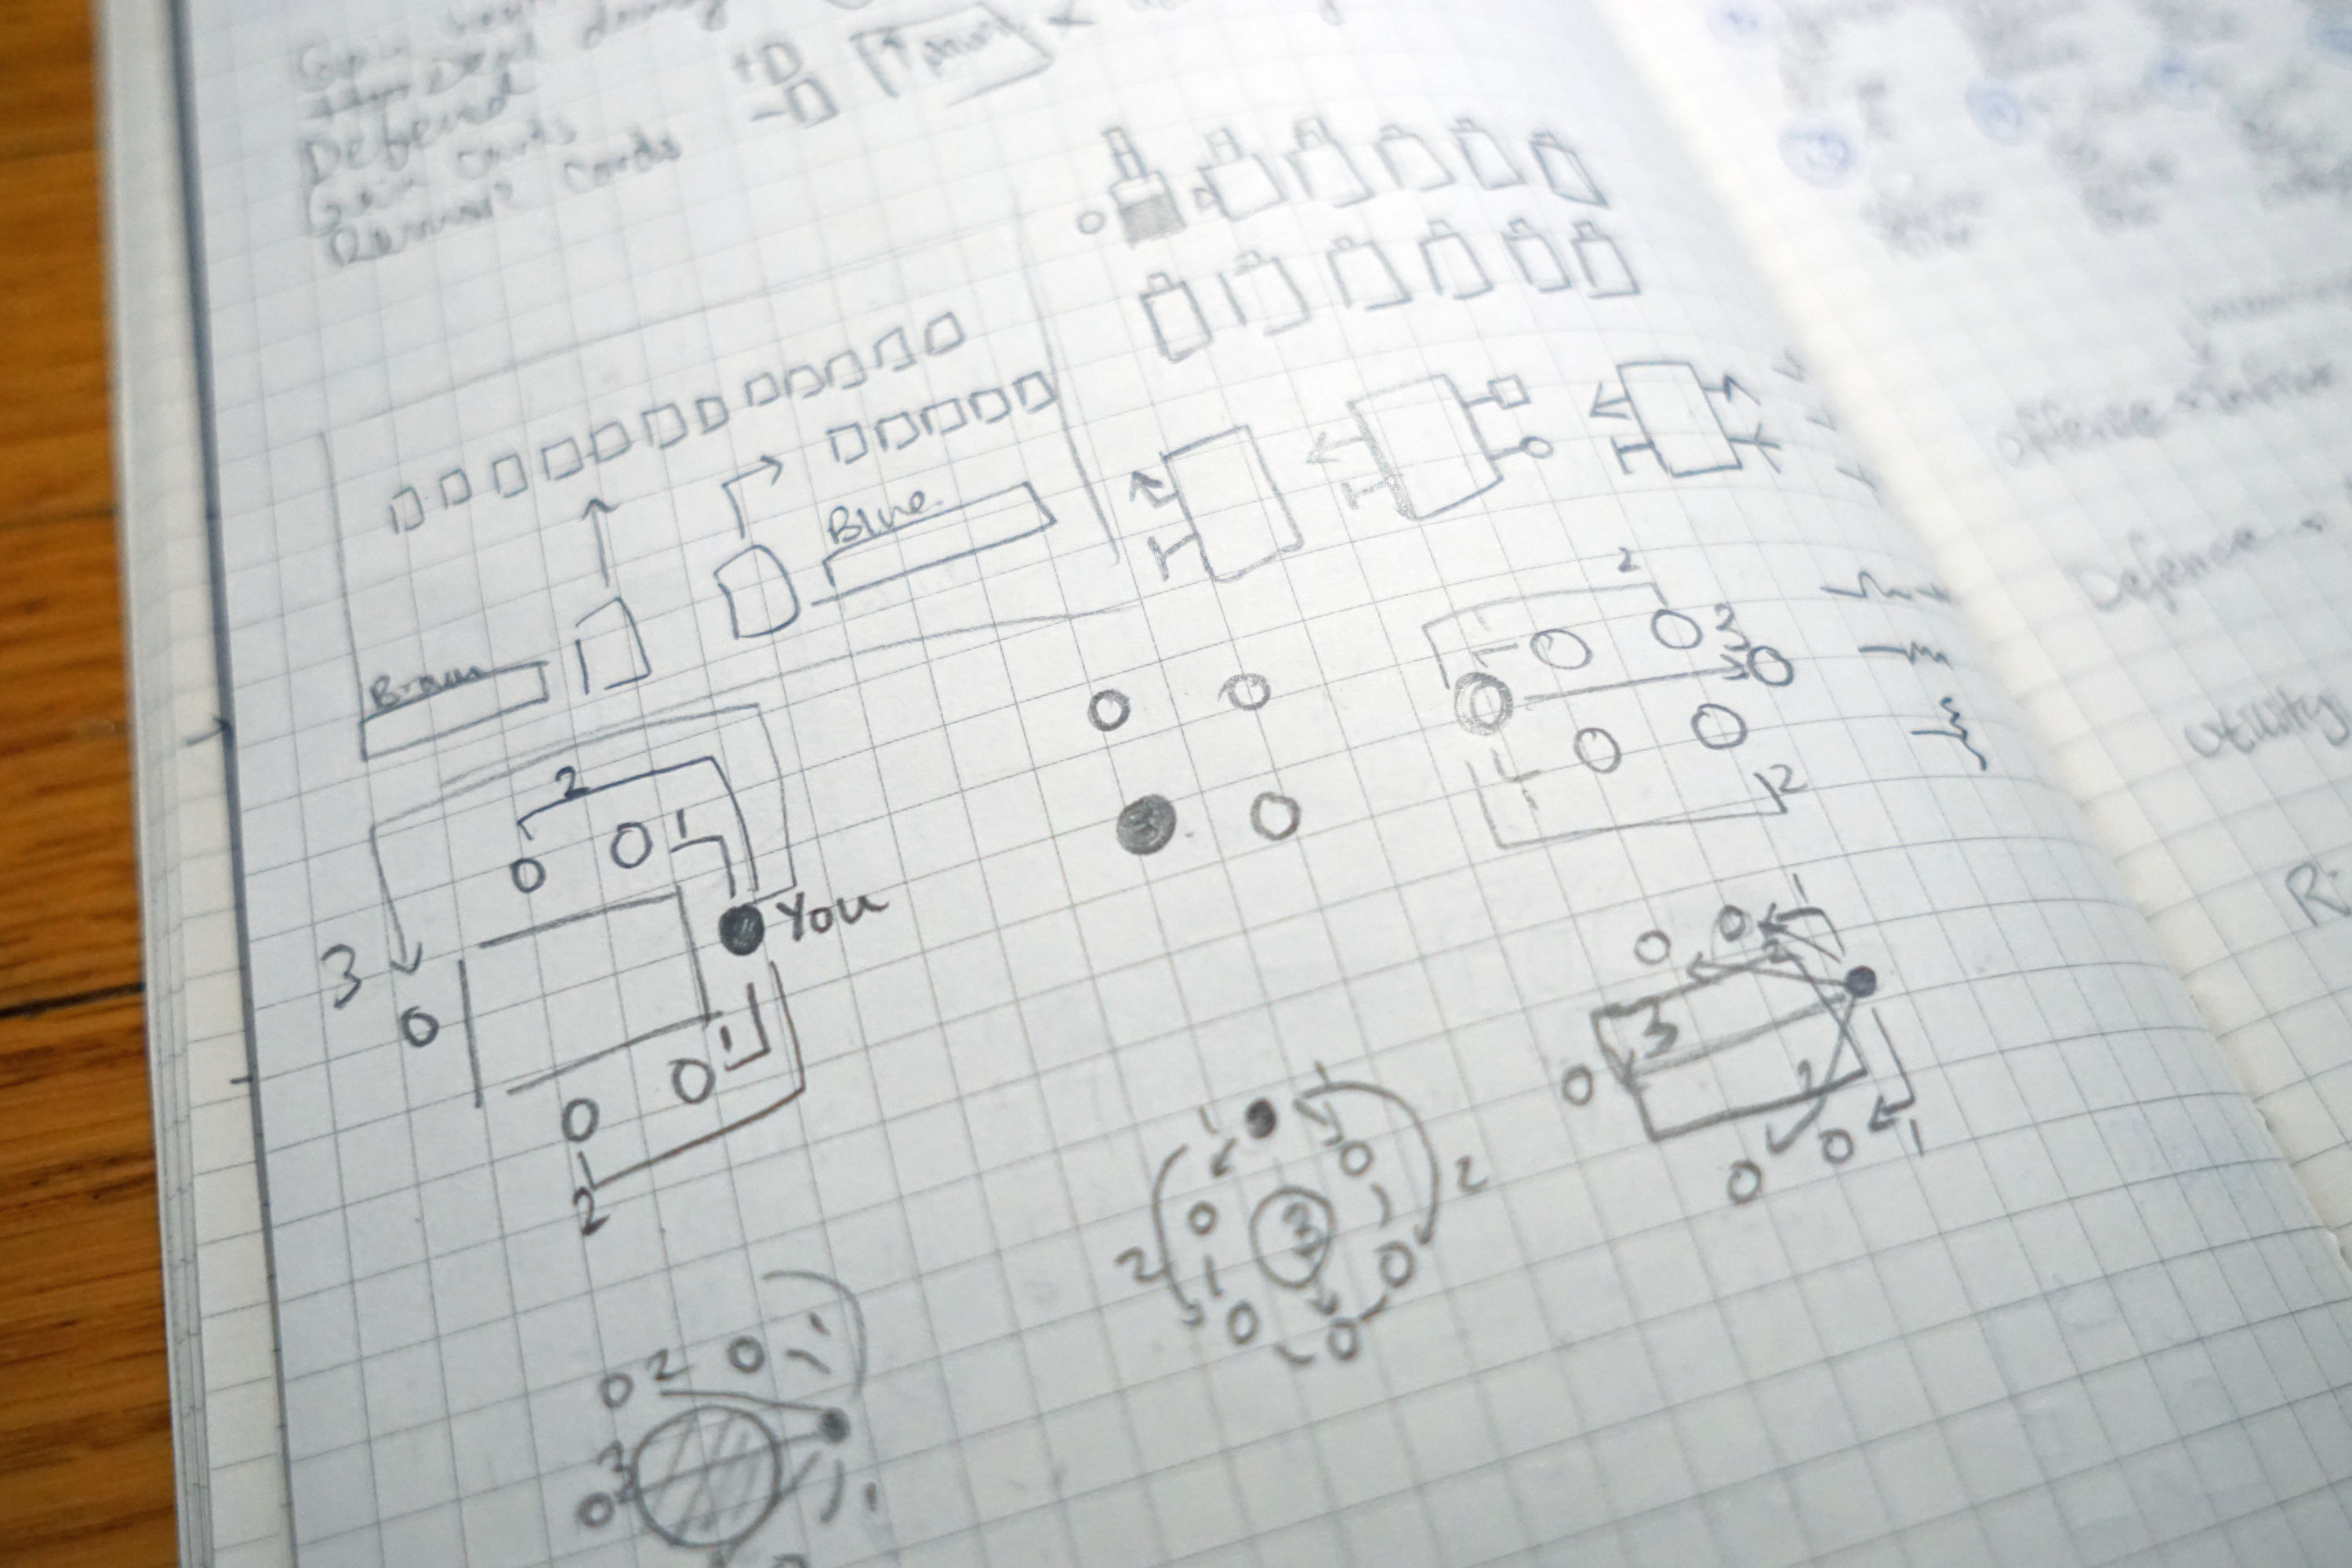
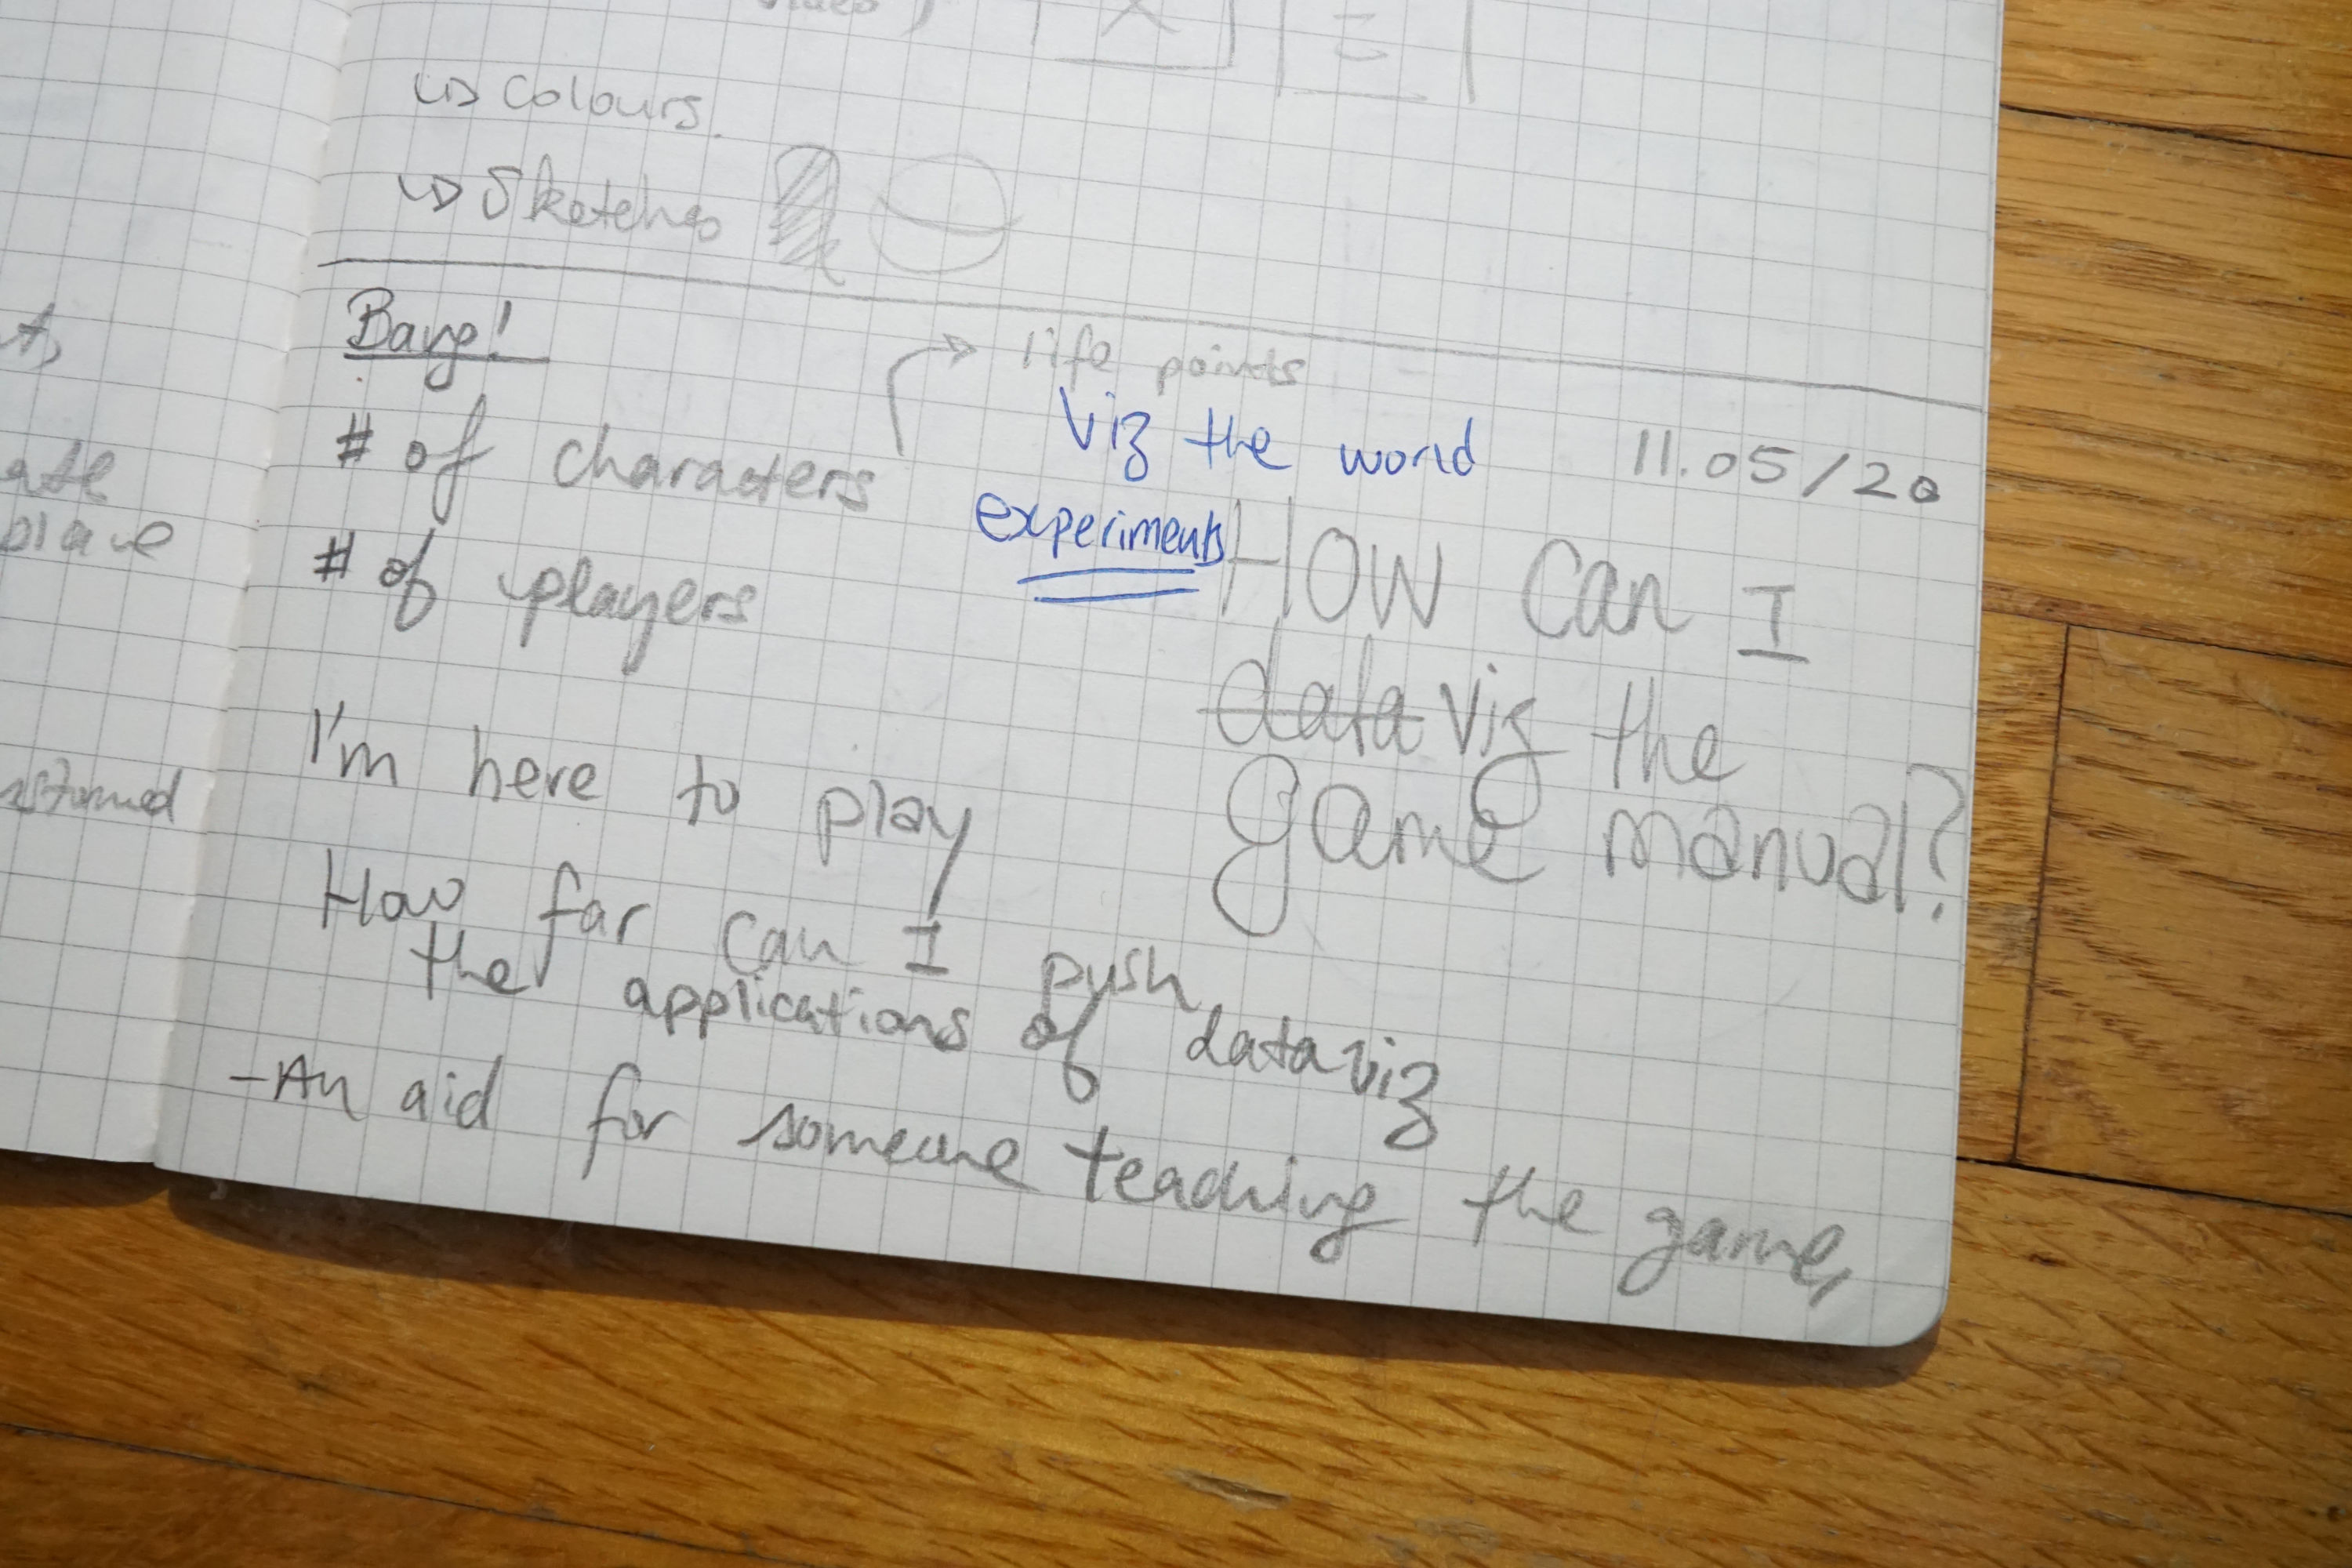
The first thing I thought about when I was tackling this project was wondering how I could work viz the game manual.
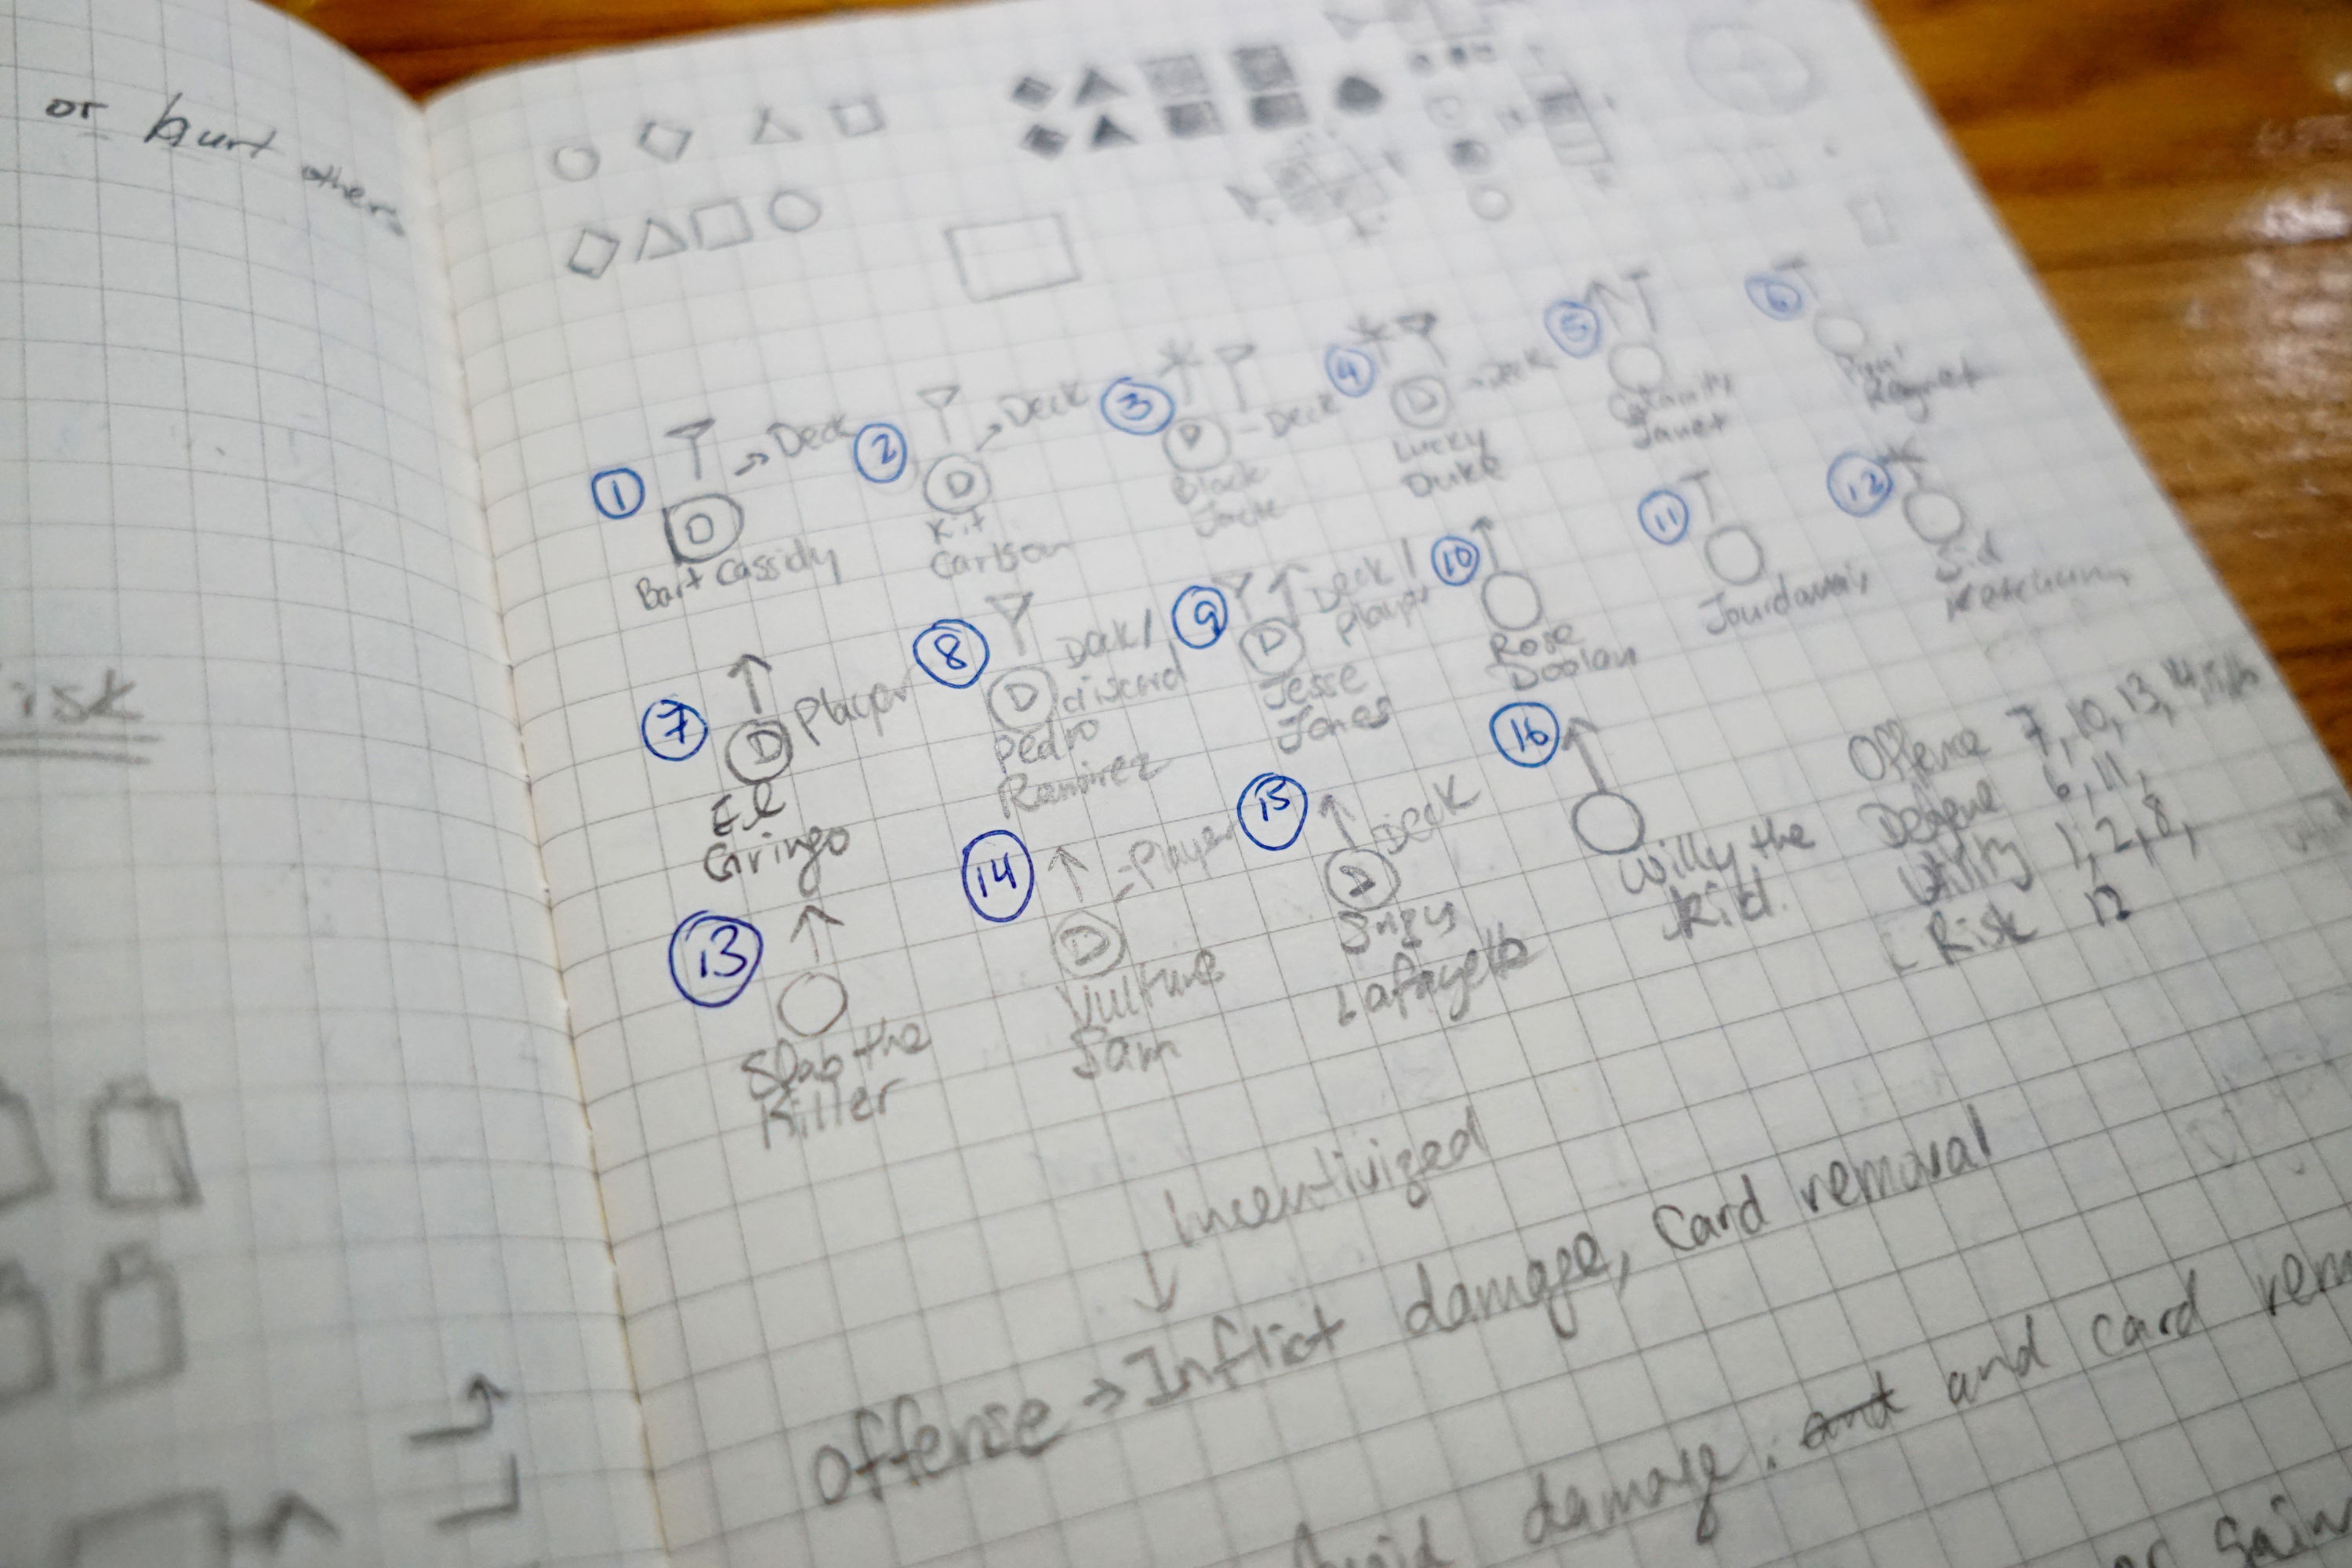
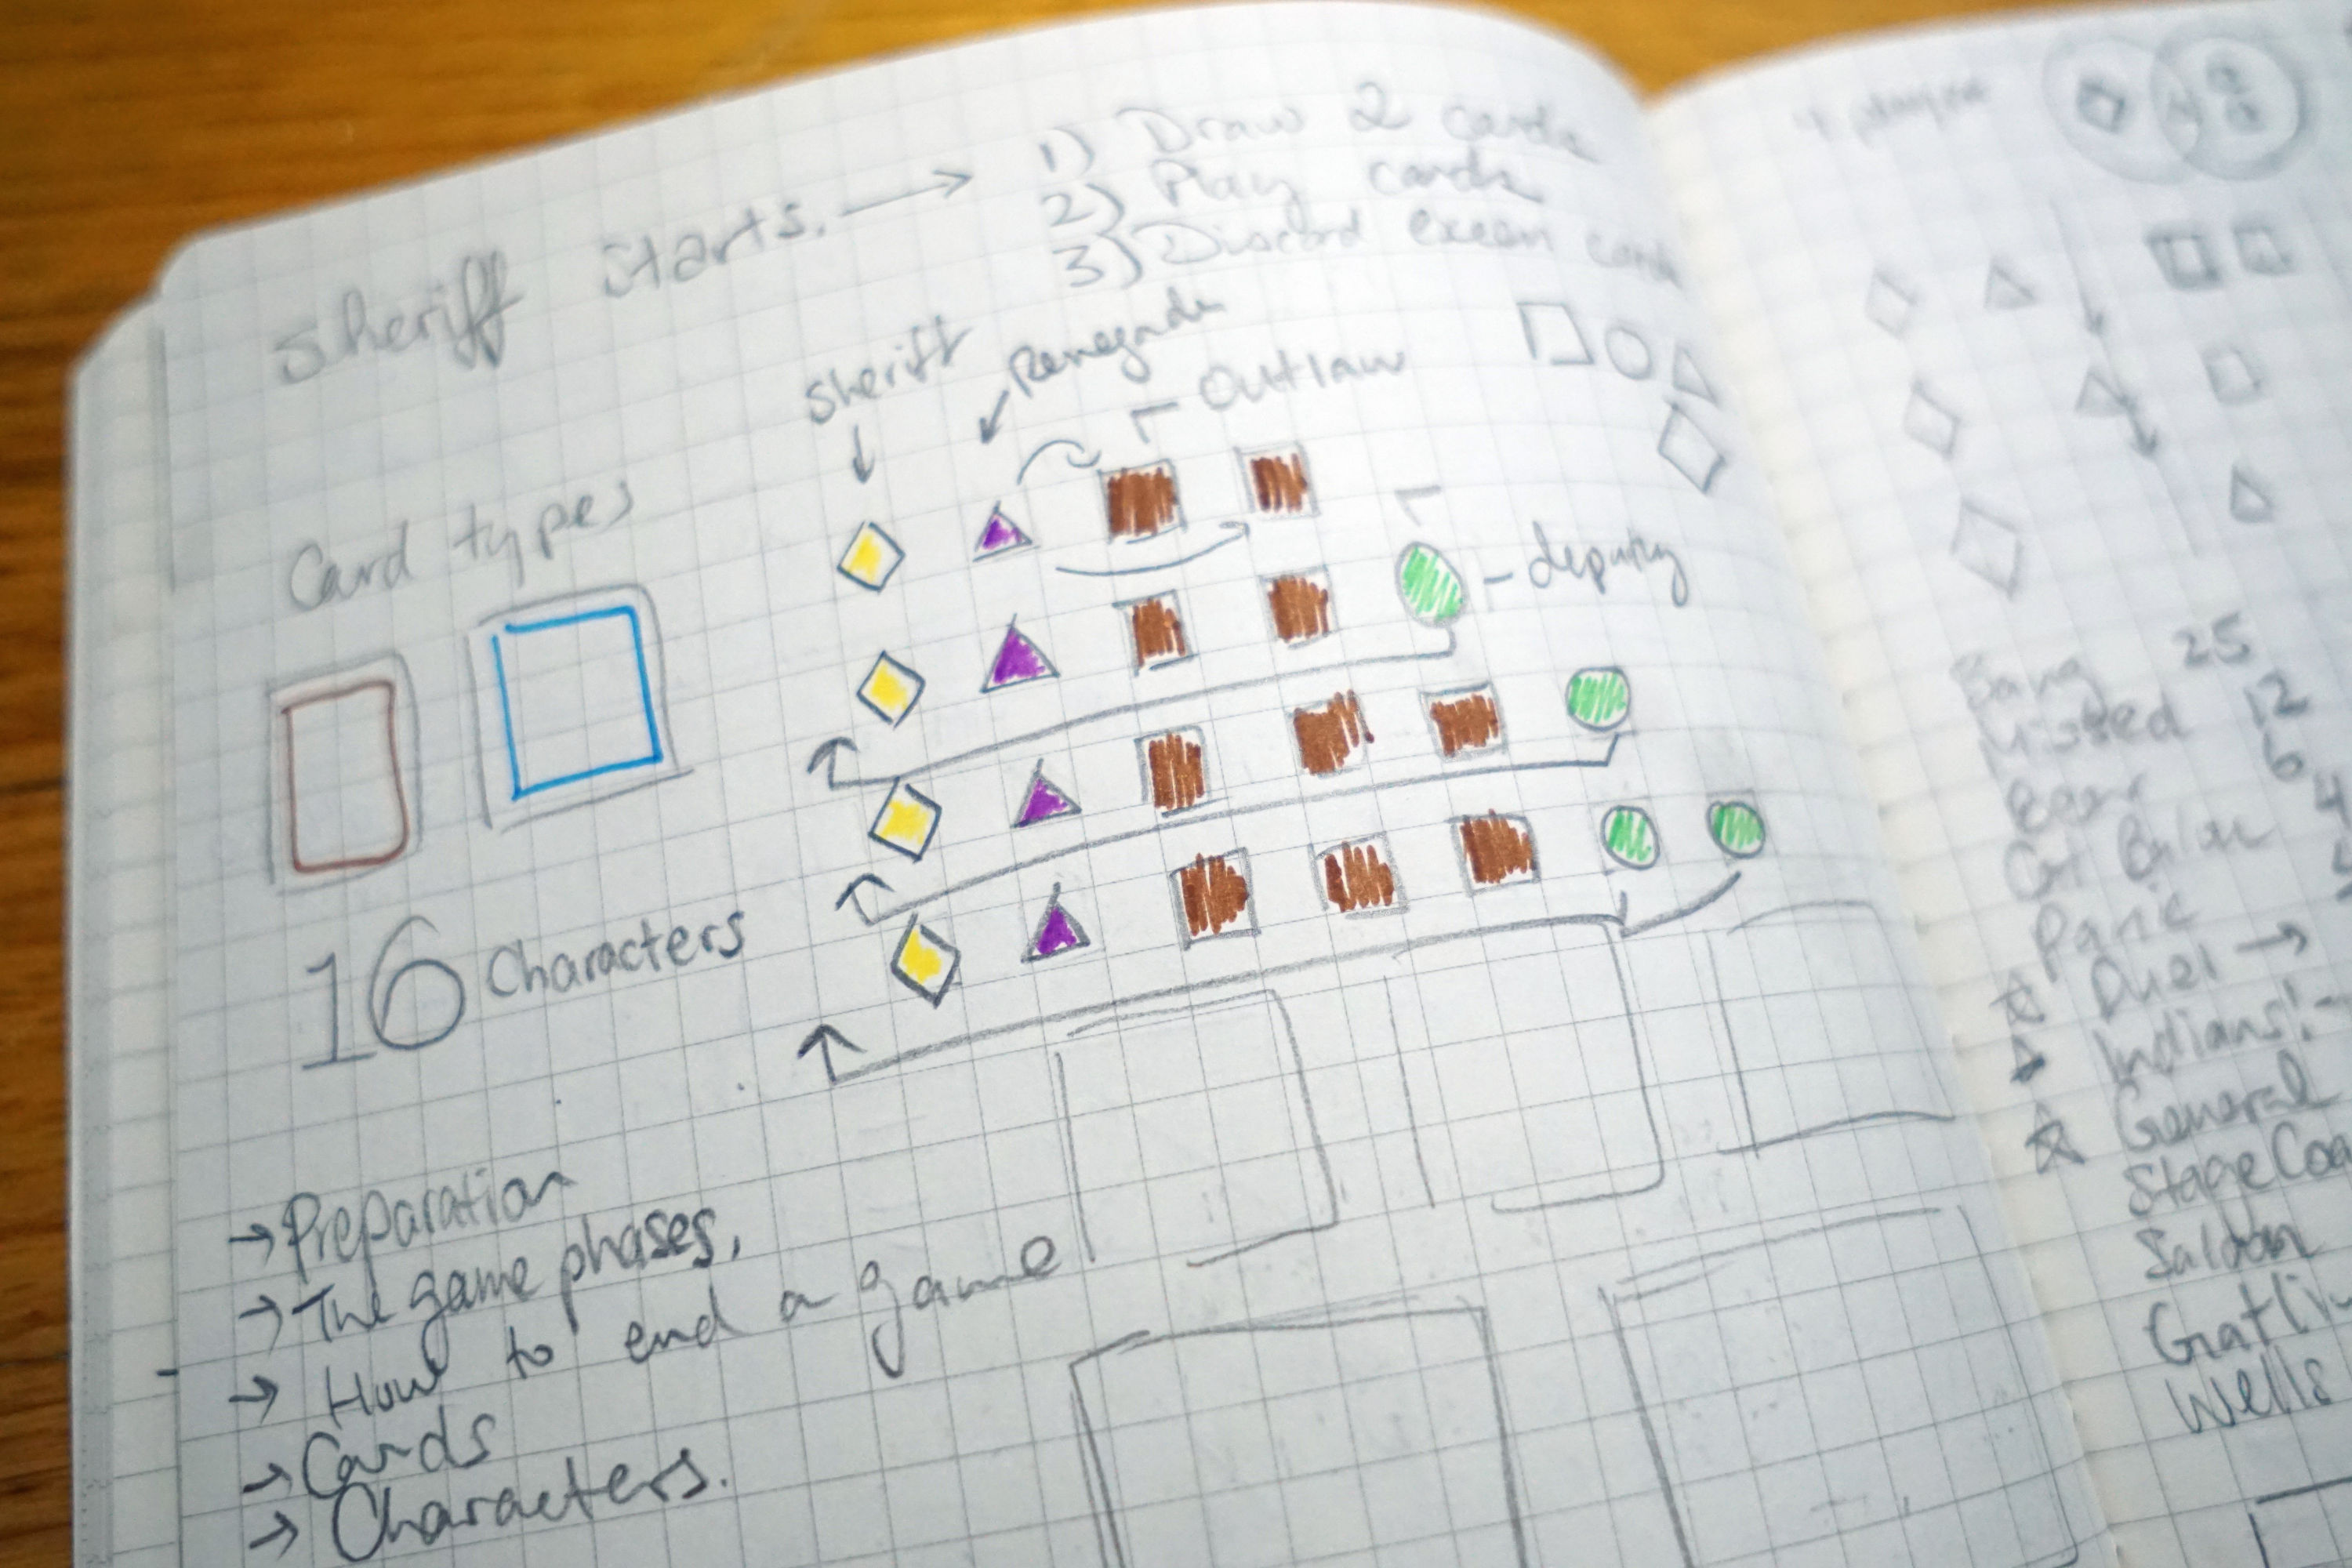
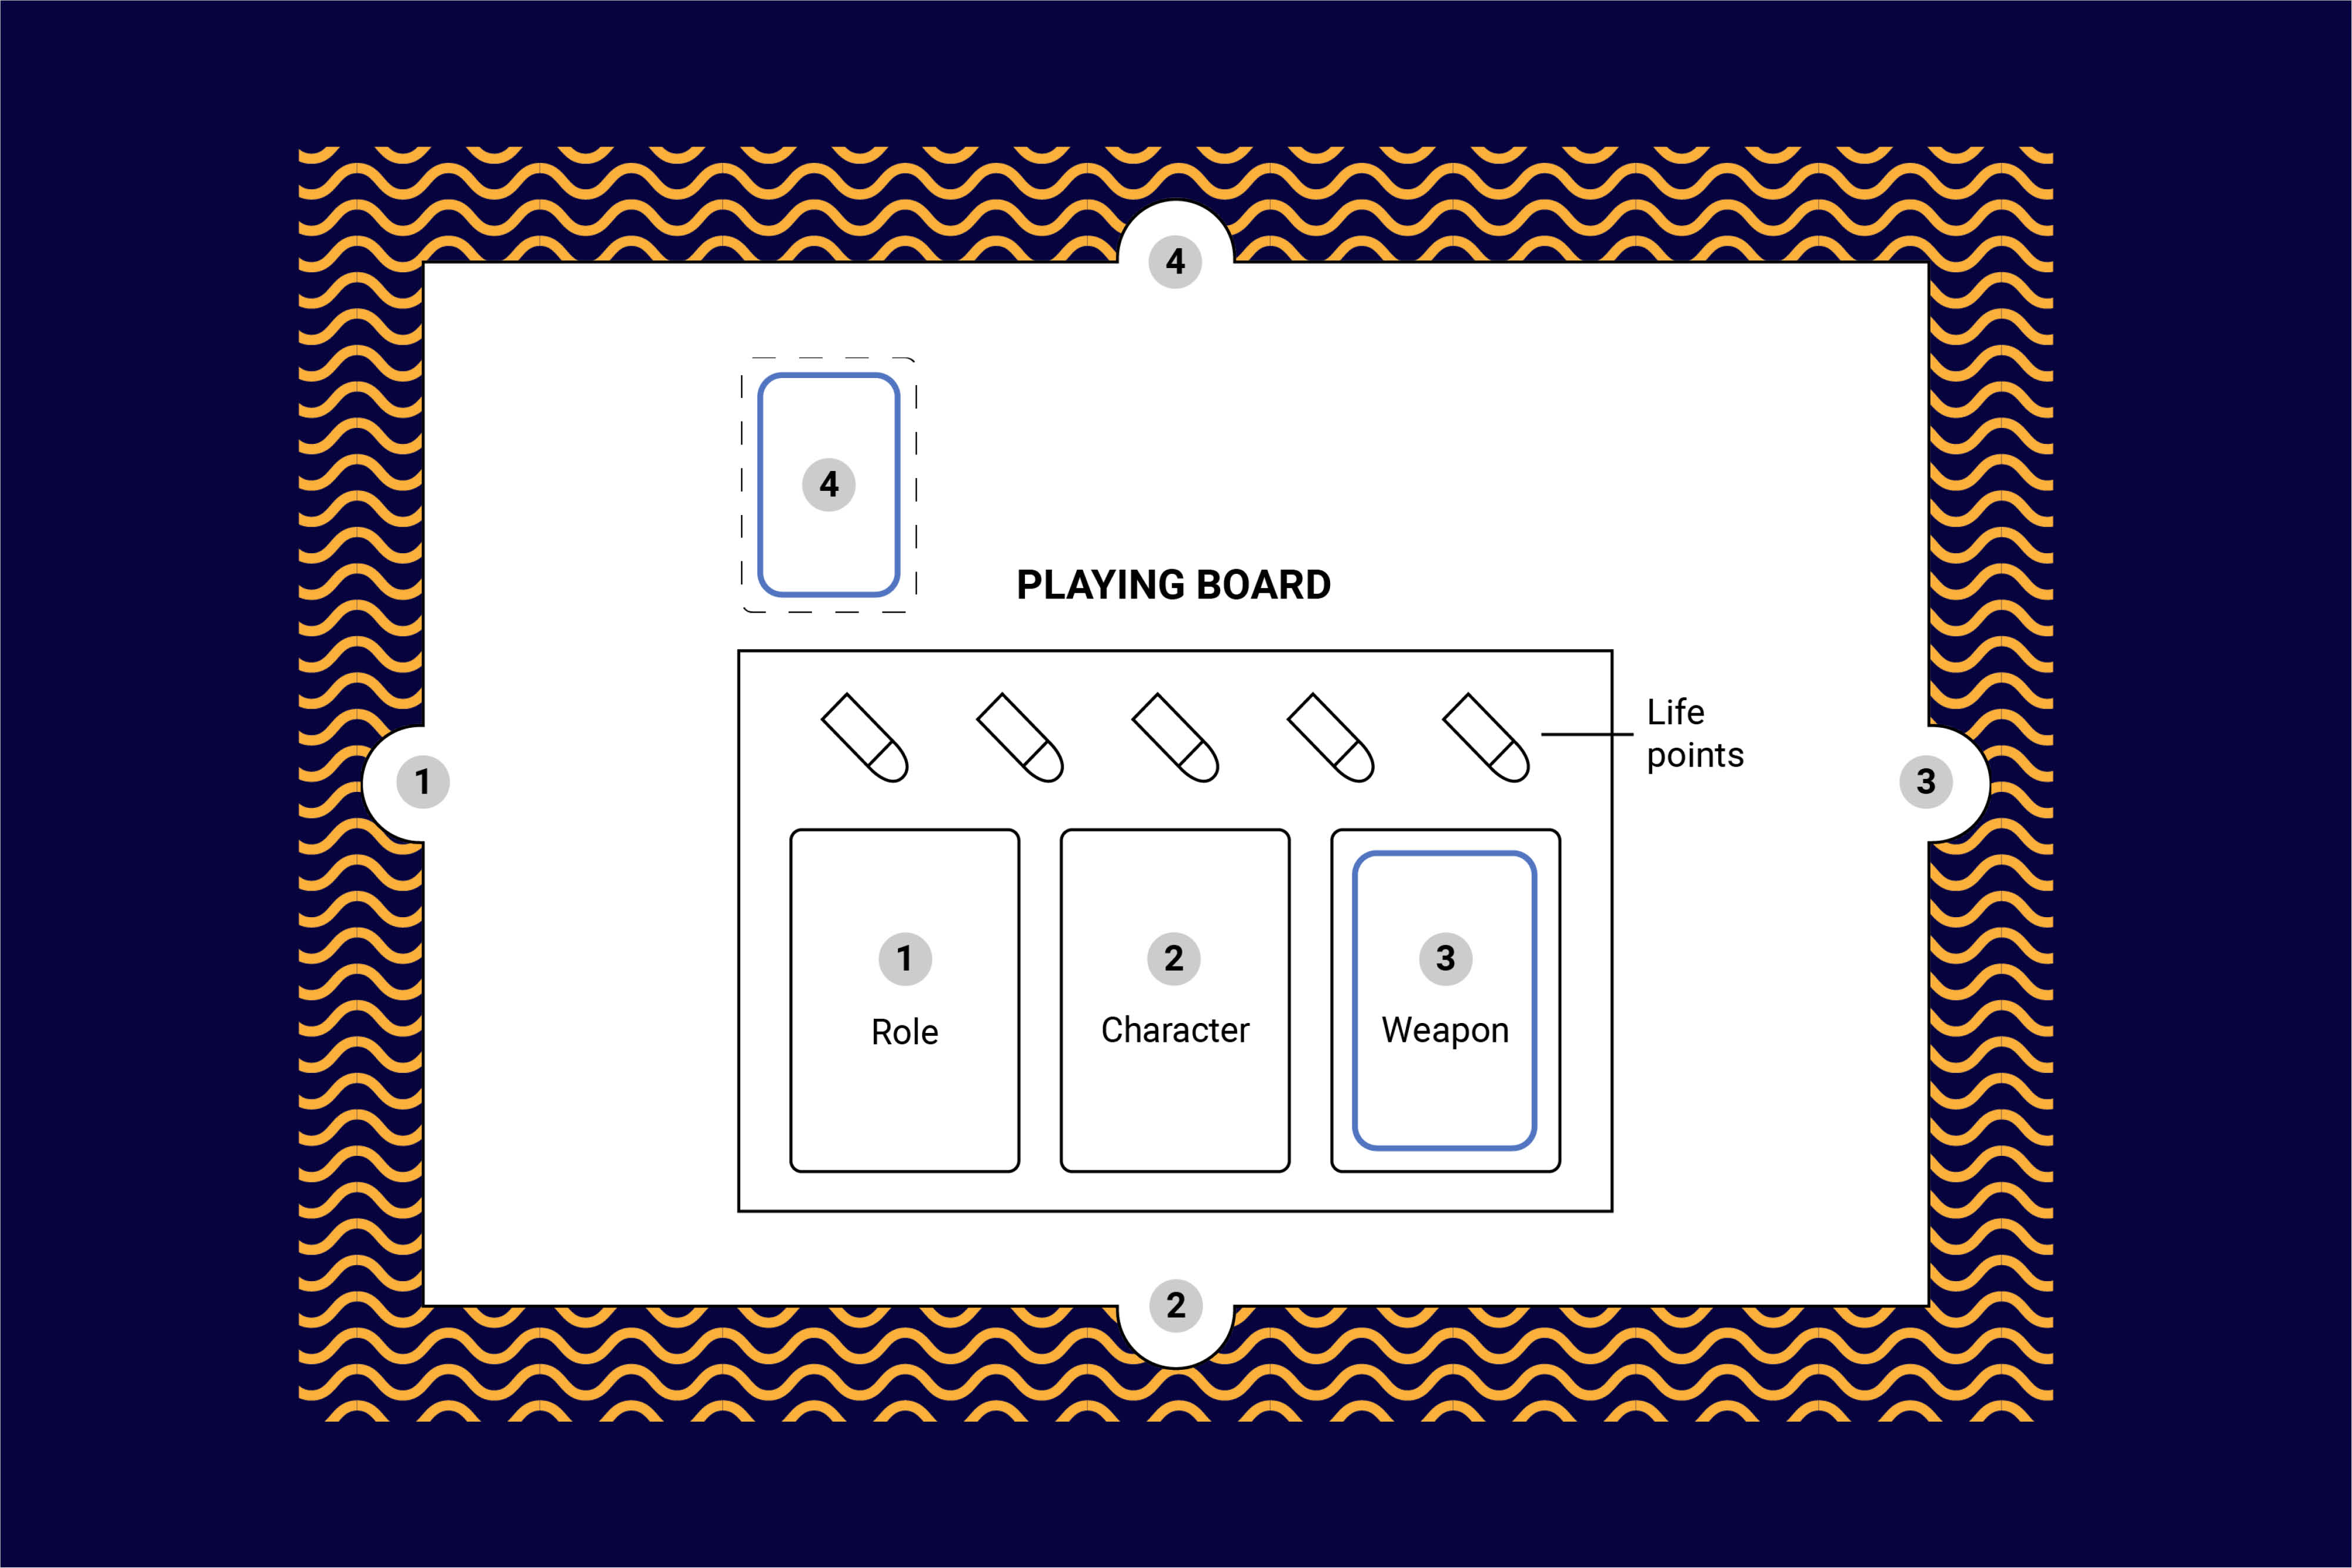
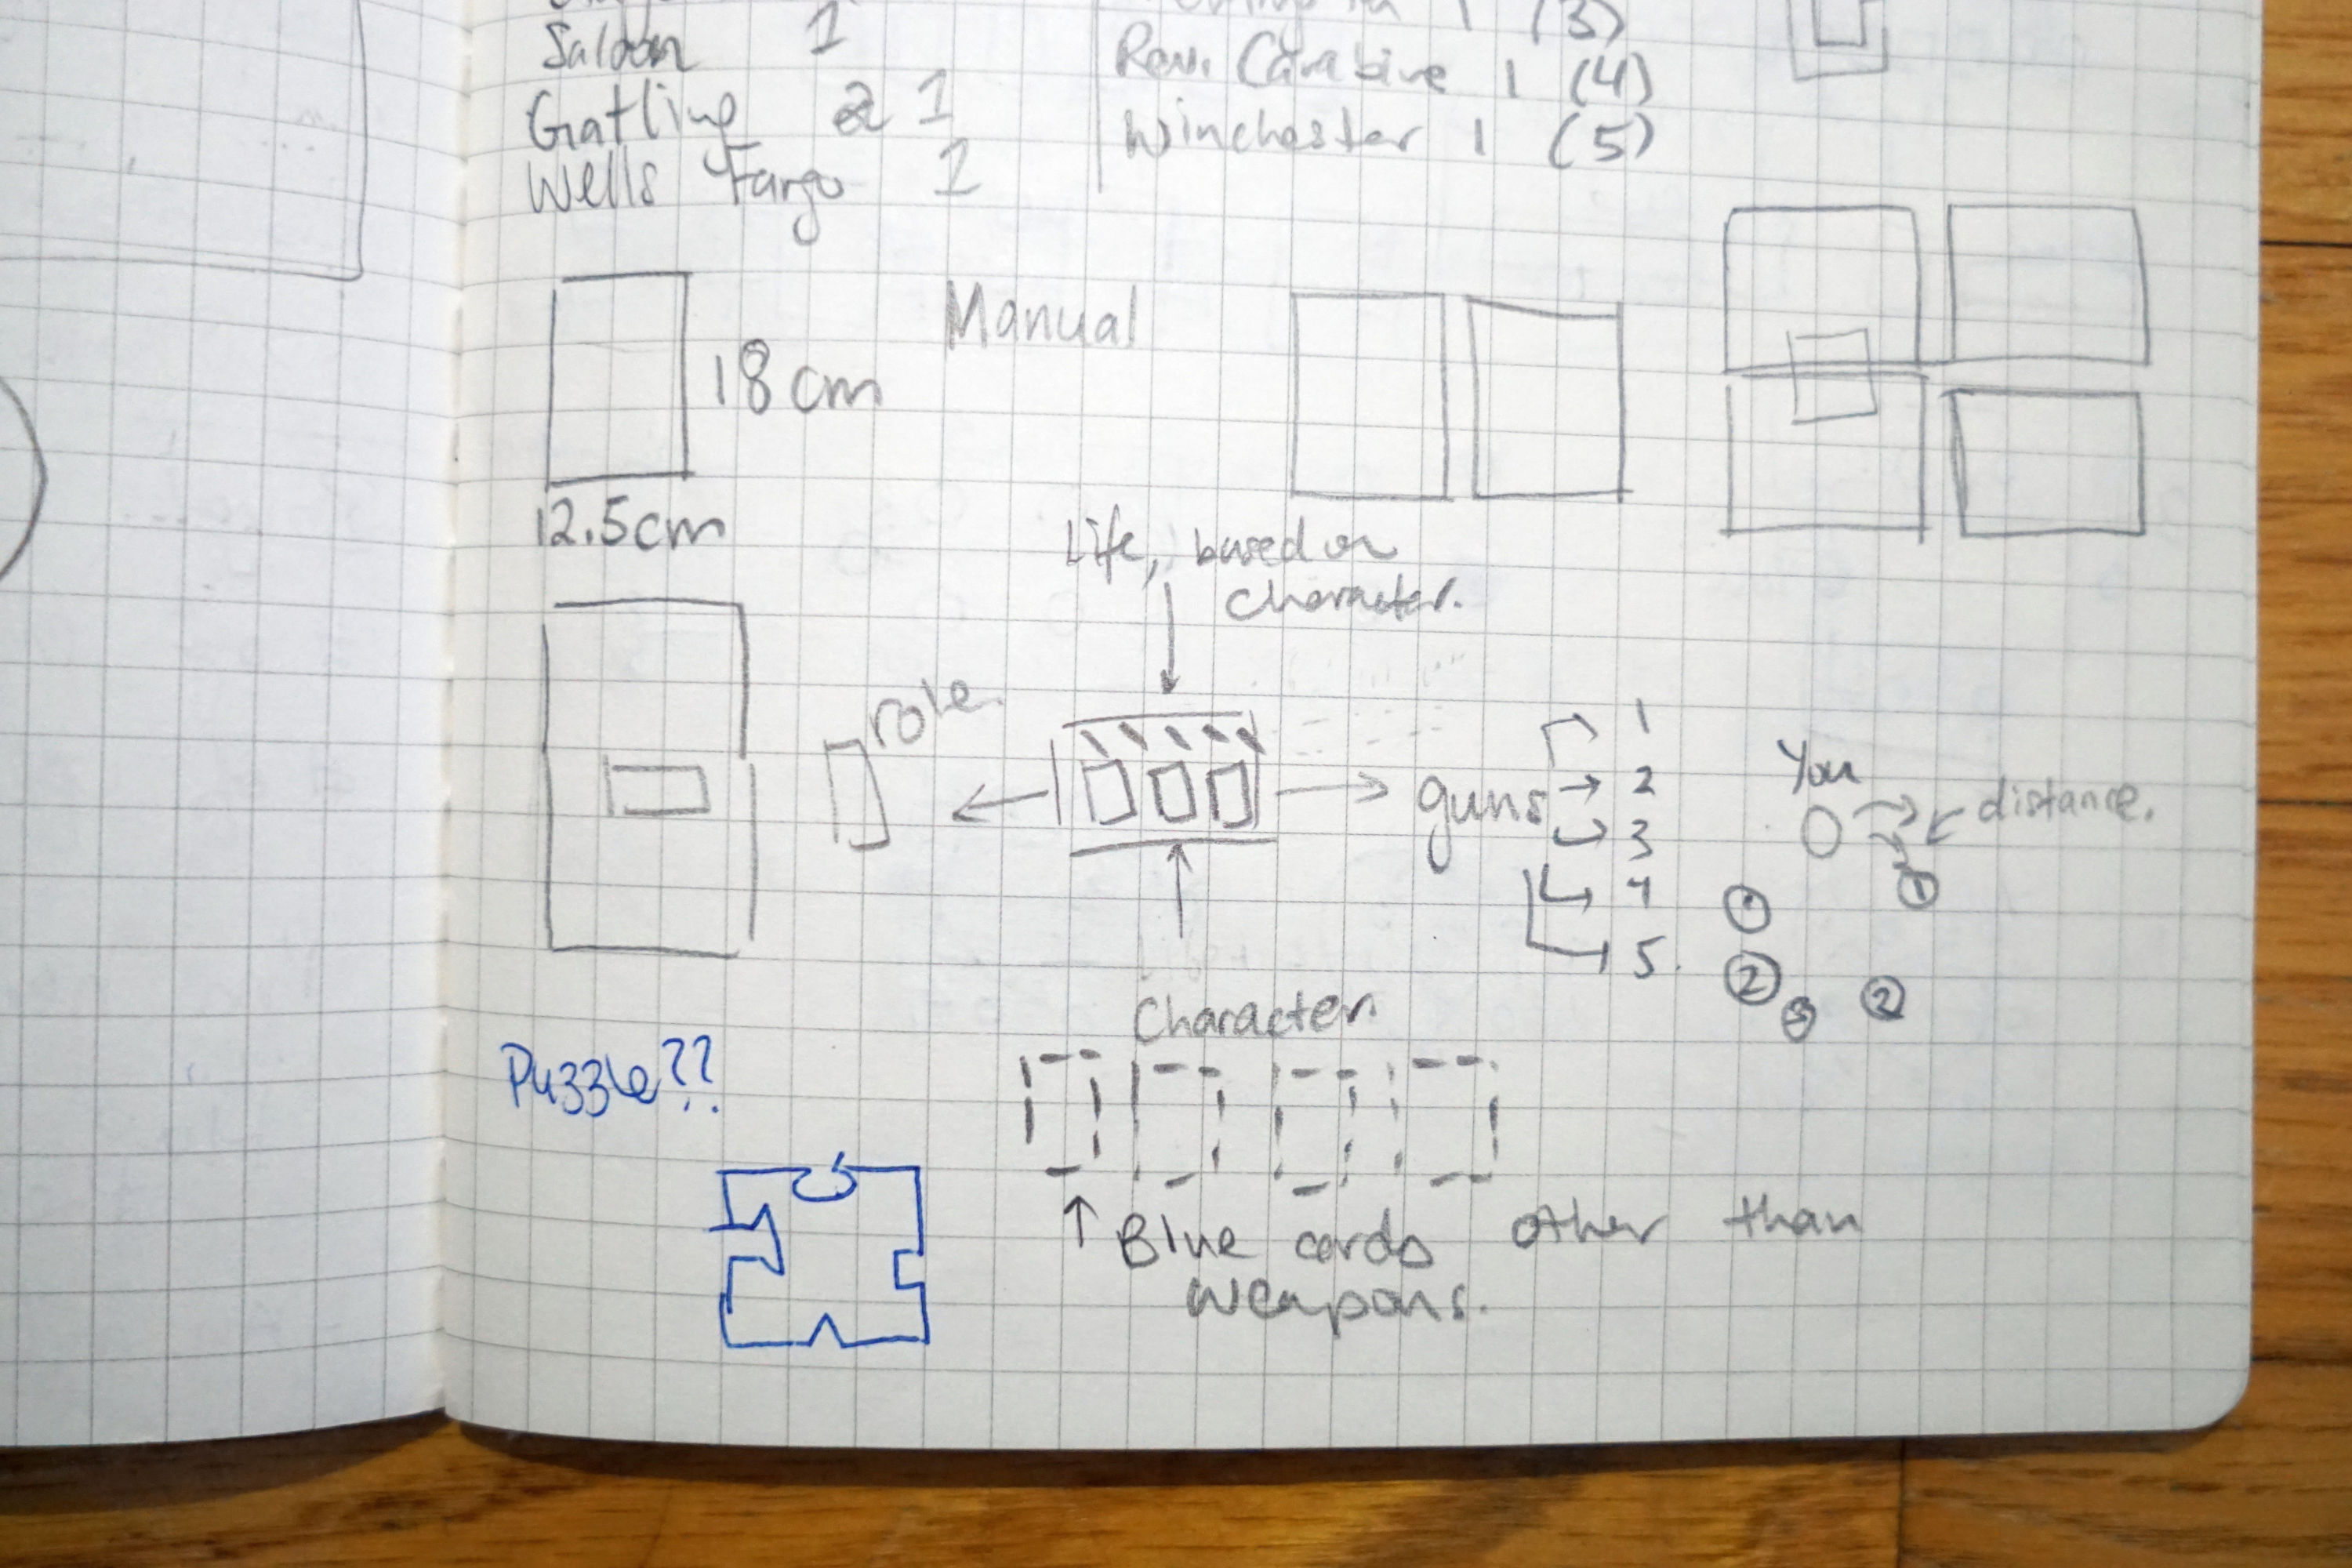
After sketching some ideas, this one stuck out to me. Creating something that was modular and revolved around the playing board.
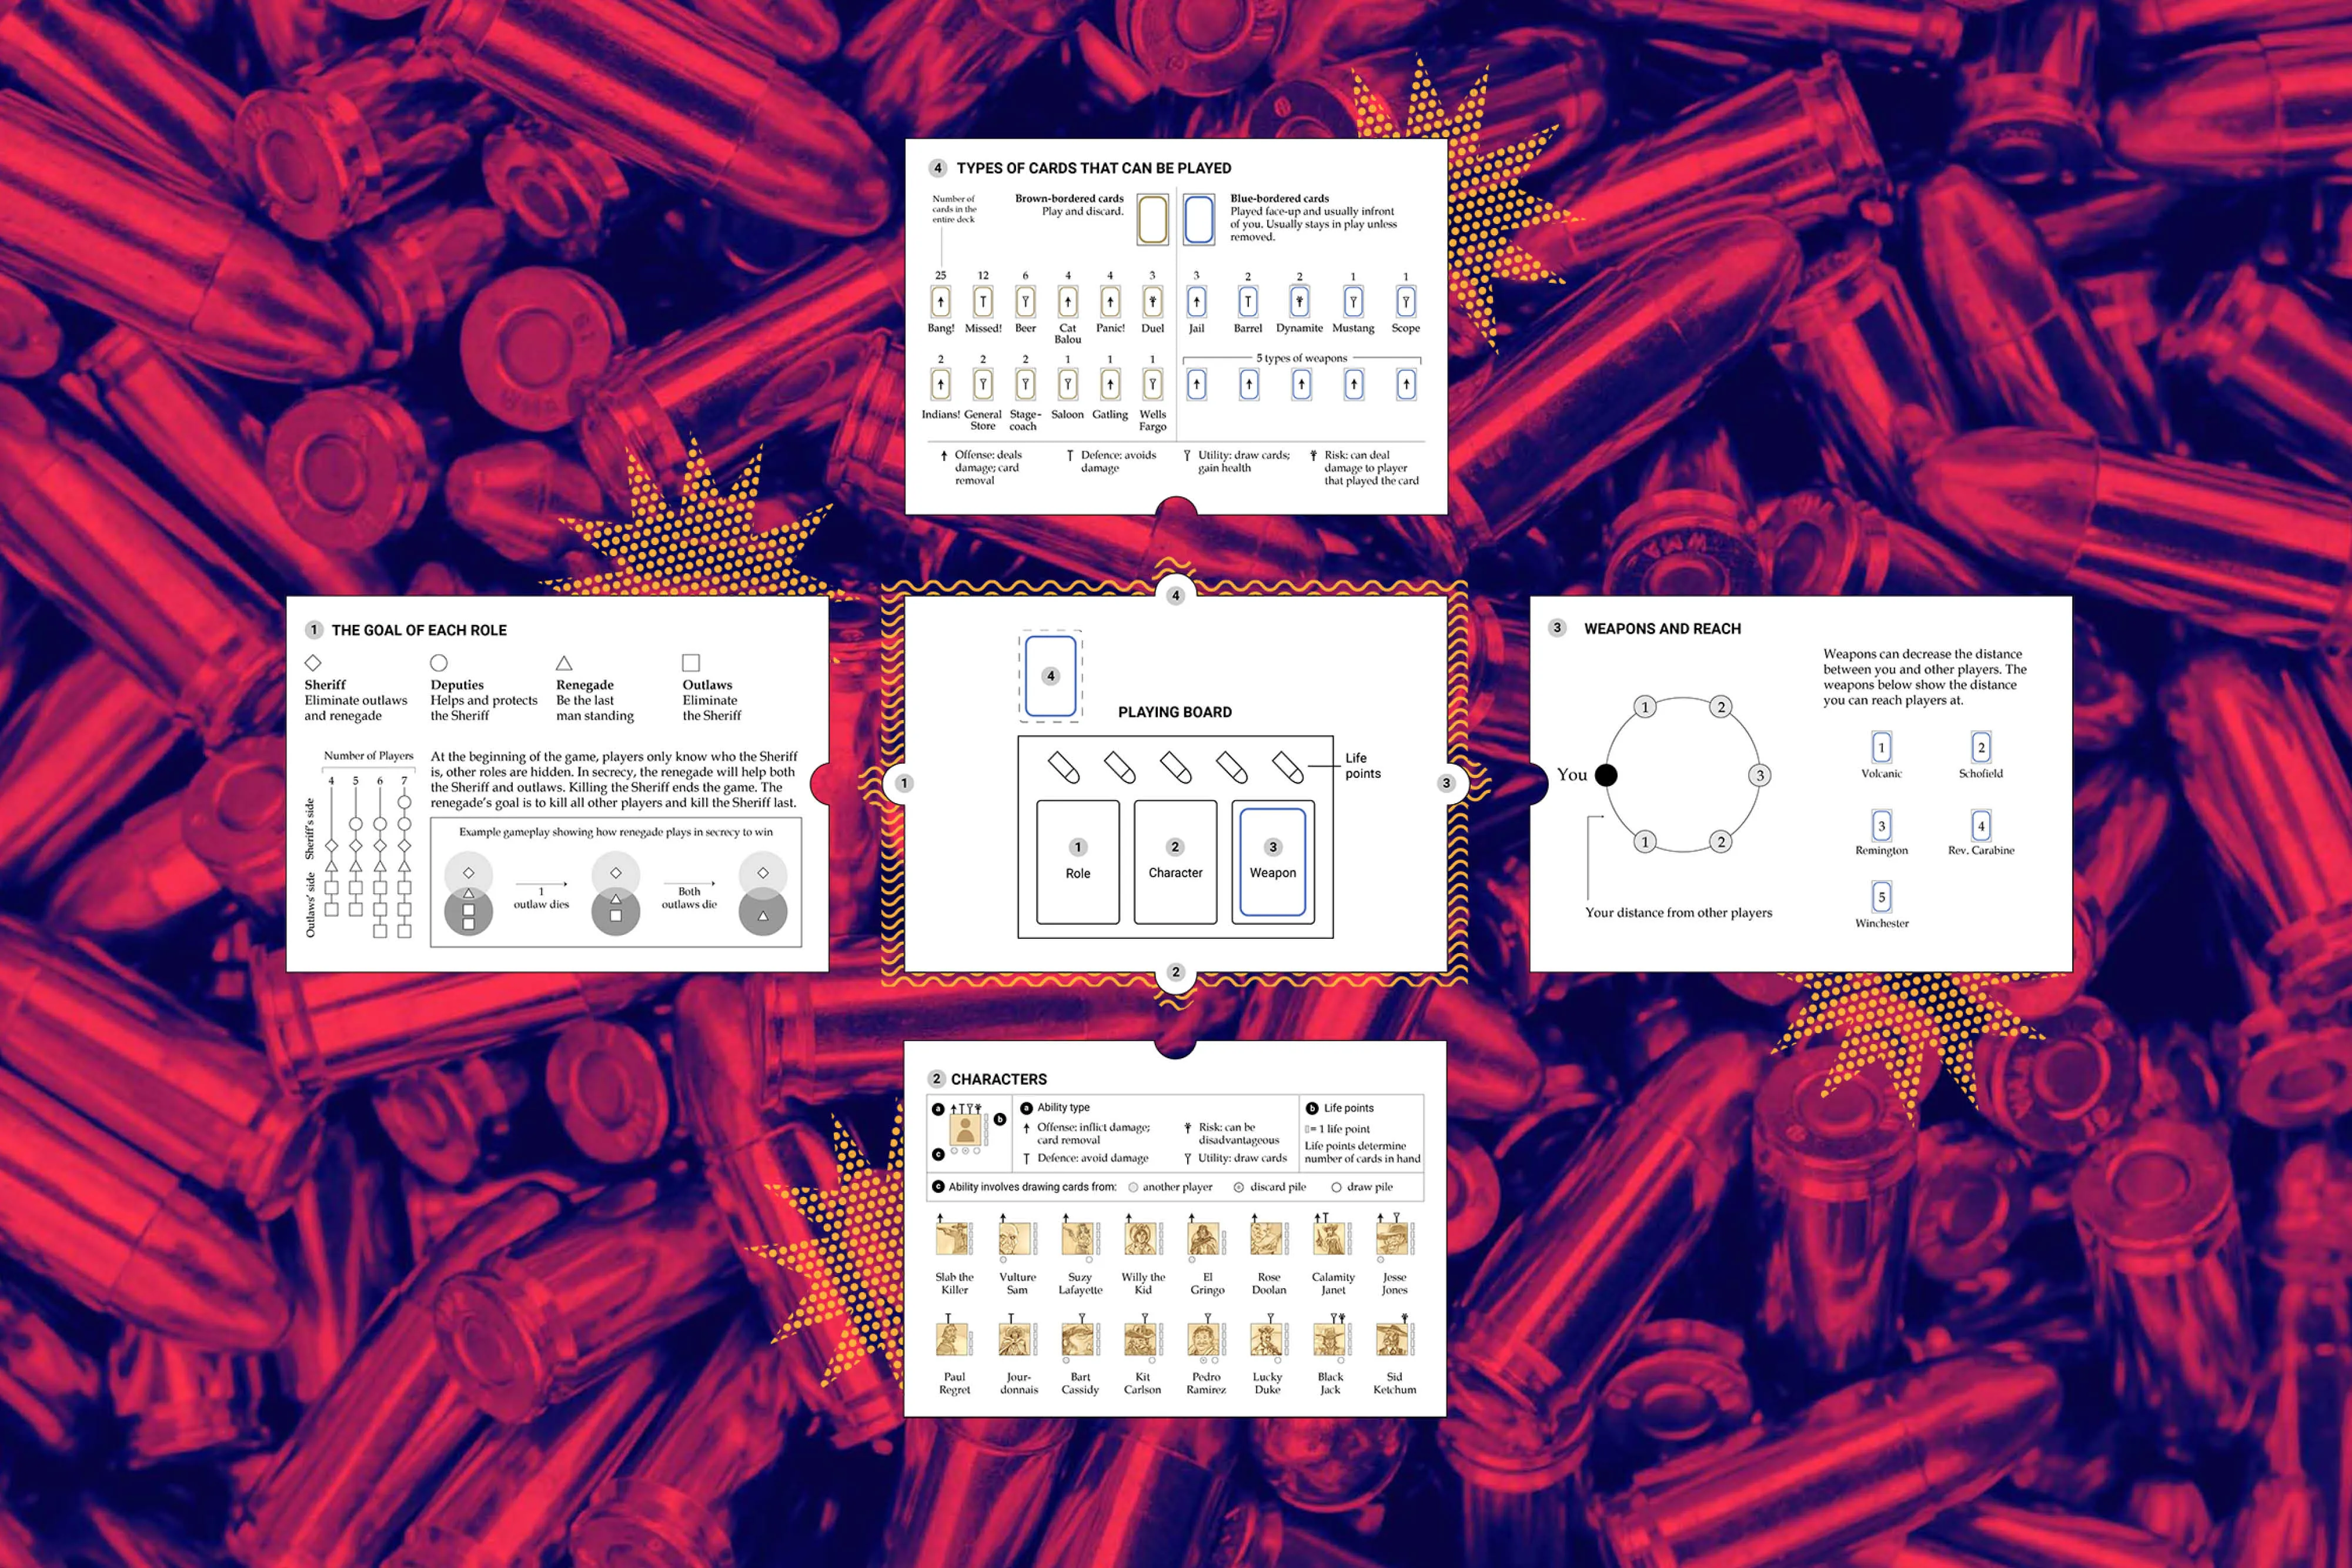
The following images show how the sketches translated to the final piece.